UHD / Office of the Provost / Office of Institutional Effectiveness / Office of Data Analytics & Institutional Research / Masters Degree Graduates by Gender & Ethnicity
Masters Degree Graduates by Gender & Ethnicity
*This page is best viewed in landscape mode
Female Male Overall Back to Fact Book Home
Female
| Ethnicity | 2020 - 2021 | 2021 - 2022 | 2022 - 2023 | 2023 - 2024 | 2024 - 2025 | % change from Previous Year |
|||||
|---|---|---|---|---|---|---|---|---|---|---|---|
| American Indian or Alaska Native | 1 | 0.3% | 0 | 0.0% | 0 | 0.0% | 0 | 0.0% | 1 | 0.3% | - |
| Asian | 38 | 12.8% | 36 | 10.3% | 31 | 10.4% | 31 | 11.1% | 25 | 8.7% | -19.4% |
| Black or African American | 111 | 37.4% | 119 | 34.0% | 86 | 29.0% | 81 | 29.0% | 97 | 33.9% | 19.8% |
| Hispanic/Latino | 70 | 23.6% | 117 | 33.4% | 111 | 37.4% | 117 | 41.9% | 106 | 37.1% | -9.4% |
| White | 57 | 19.2% | 50 | 14.3% | 42 | 14.1% | 31 | 11.1% | 31 | 10.8% | 0.0% |
| Native Hawaiian or Other Pacific Islander | 0 | 0.0% | 0 | 0.0% | 0 | 0.0% | 0 | 0.0% | 1 | 0.3% | - |
| Two or More Races | 4 | 1.3% | 13 | 3.7% | 10 | 3.4% | 6 | 2.2% | 8 | 2.8% | 33.3% |
| International | 15 | 5.1% | 13 | 3.7% | 16 | 5.4% | 12 | 4.3% | 14 | 4.9% | 16.7% |
| Race and ethnicity unknown | 1 | 0.3% | 2 | 0.6% | 1 | 0.3% | 1 | 0.4% | 3 | 1.0% | 200.0% |
| Total Females | 297 | 100.0% | 350 | 100.0% | 297 | 100.0% | 279 | 100.0% | 286 | 100.0% | 2.5% |
Male
| Ethnicity | 2020 - 2021 | 2021 - 2022 | 2022 - 2023 | 2023 - 2024 | 2024 - 2025 | % change from Previous Year |
|||||
|---|---|---|---|---|---|---|---|---|---|---|---|
| American Indian or Alaska Native | 0 | 0.0% | 1 | 0.4% | 0 | 0.0% | 1 | 0.6% | 0 | 0.0% | -100.0% |
| Asian | 25 | 11.5% | 34 | 14.8% | 26 | 12.0% | 22 | 13.1% | 25 | 14.1% | 13.6% |
| Black or African American | 42 | 19.4% | 69 | 30.0% | 58 | 26.7% | 40 | 23.8% | 42 | 23.7% | 5.0% |
| Hispanic/Latino | 66 | 30.4% | 72 | 31.3% | 74 | 34.1% | 55 | 32.7% | 56 | 31.6% | 1.8% |
| White | 67 | 30.9% | 33 | 14.3% | 39 | 18.0% | 31 | 18.5% | 30 | 16.9% | -3.2% |
| Native Hawaiian or Other Pacific Islander | 1 | 0.5% | 0 | 0.0% | 0 | 0.0% | 0 | 0.0% | 0 | 0.0% | - |
| Two or More Races | 6 | 2.8% | 5 | 2.2% | 6 | 2.8% | 6 | 3.6% | 5 | 2.8% | -16.7% |
| International | 7 | 3.2% | 14 | 6.1% | 13 | 6.0% | 12 | 7.1% | 18 | 10.2% | 50.0% |
| Race and ethnicity unknown | 3 | 1.4% | 2 | 0.9% | 1 | 0.5% | 1 | 0.6% | 1 | 0.6% | 0.0% |
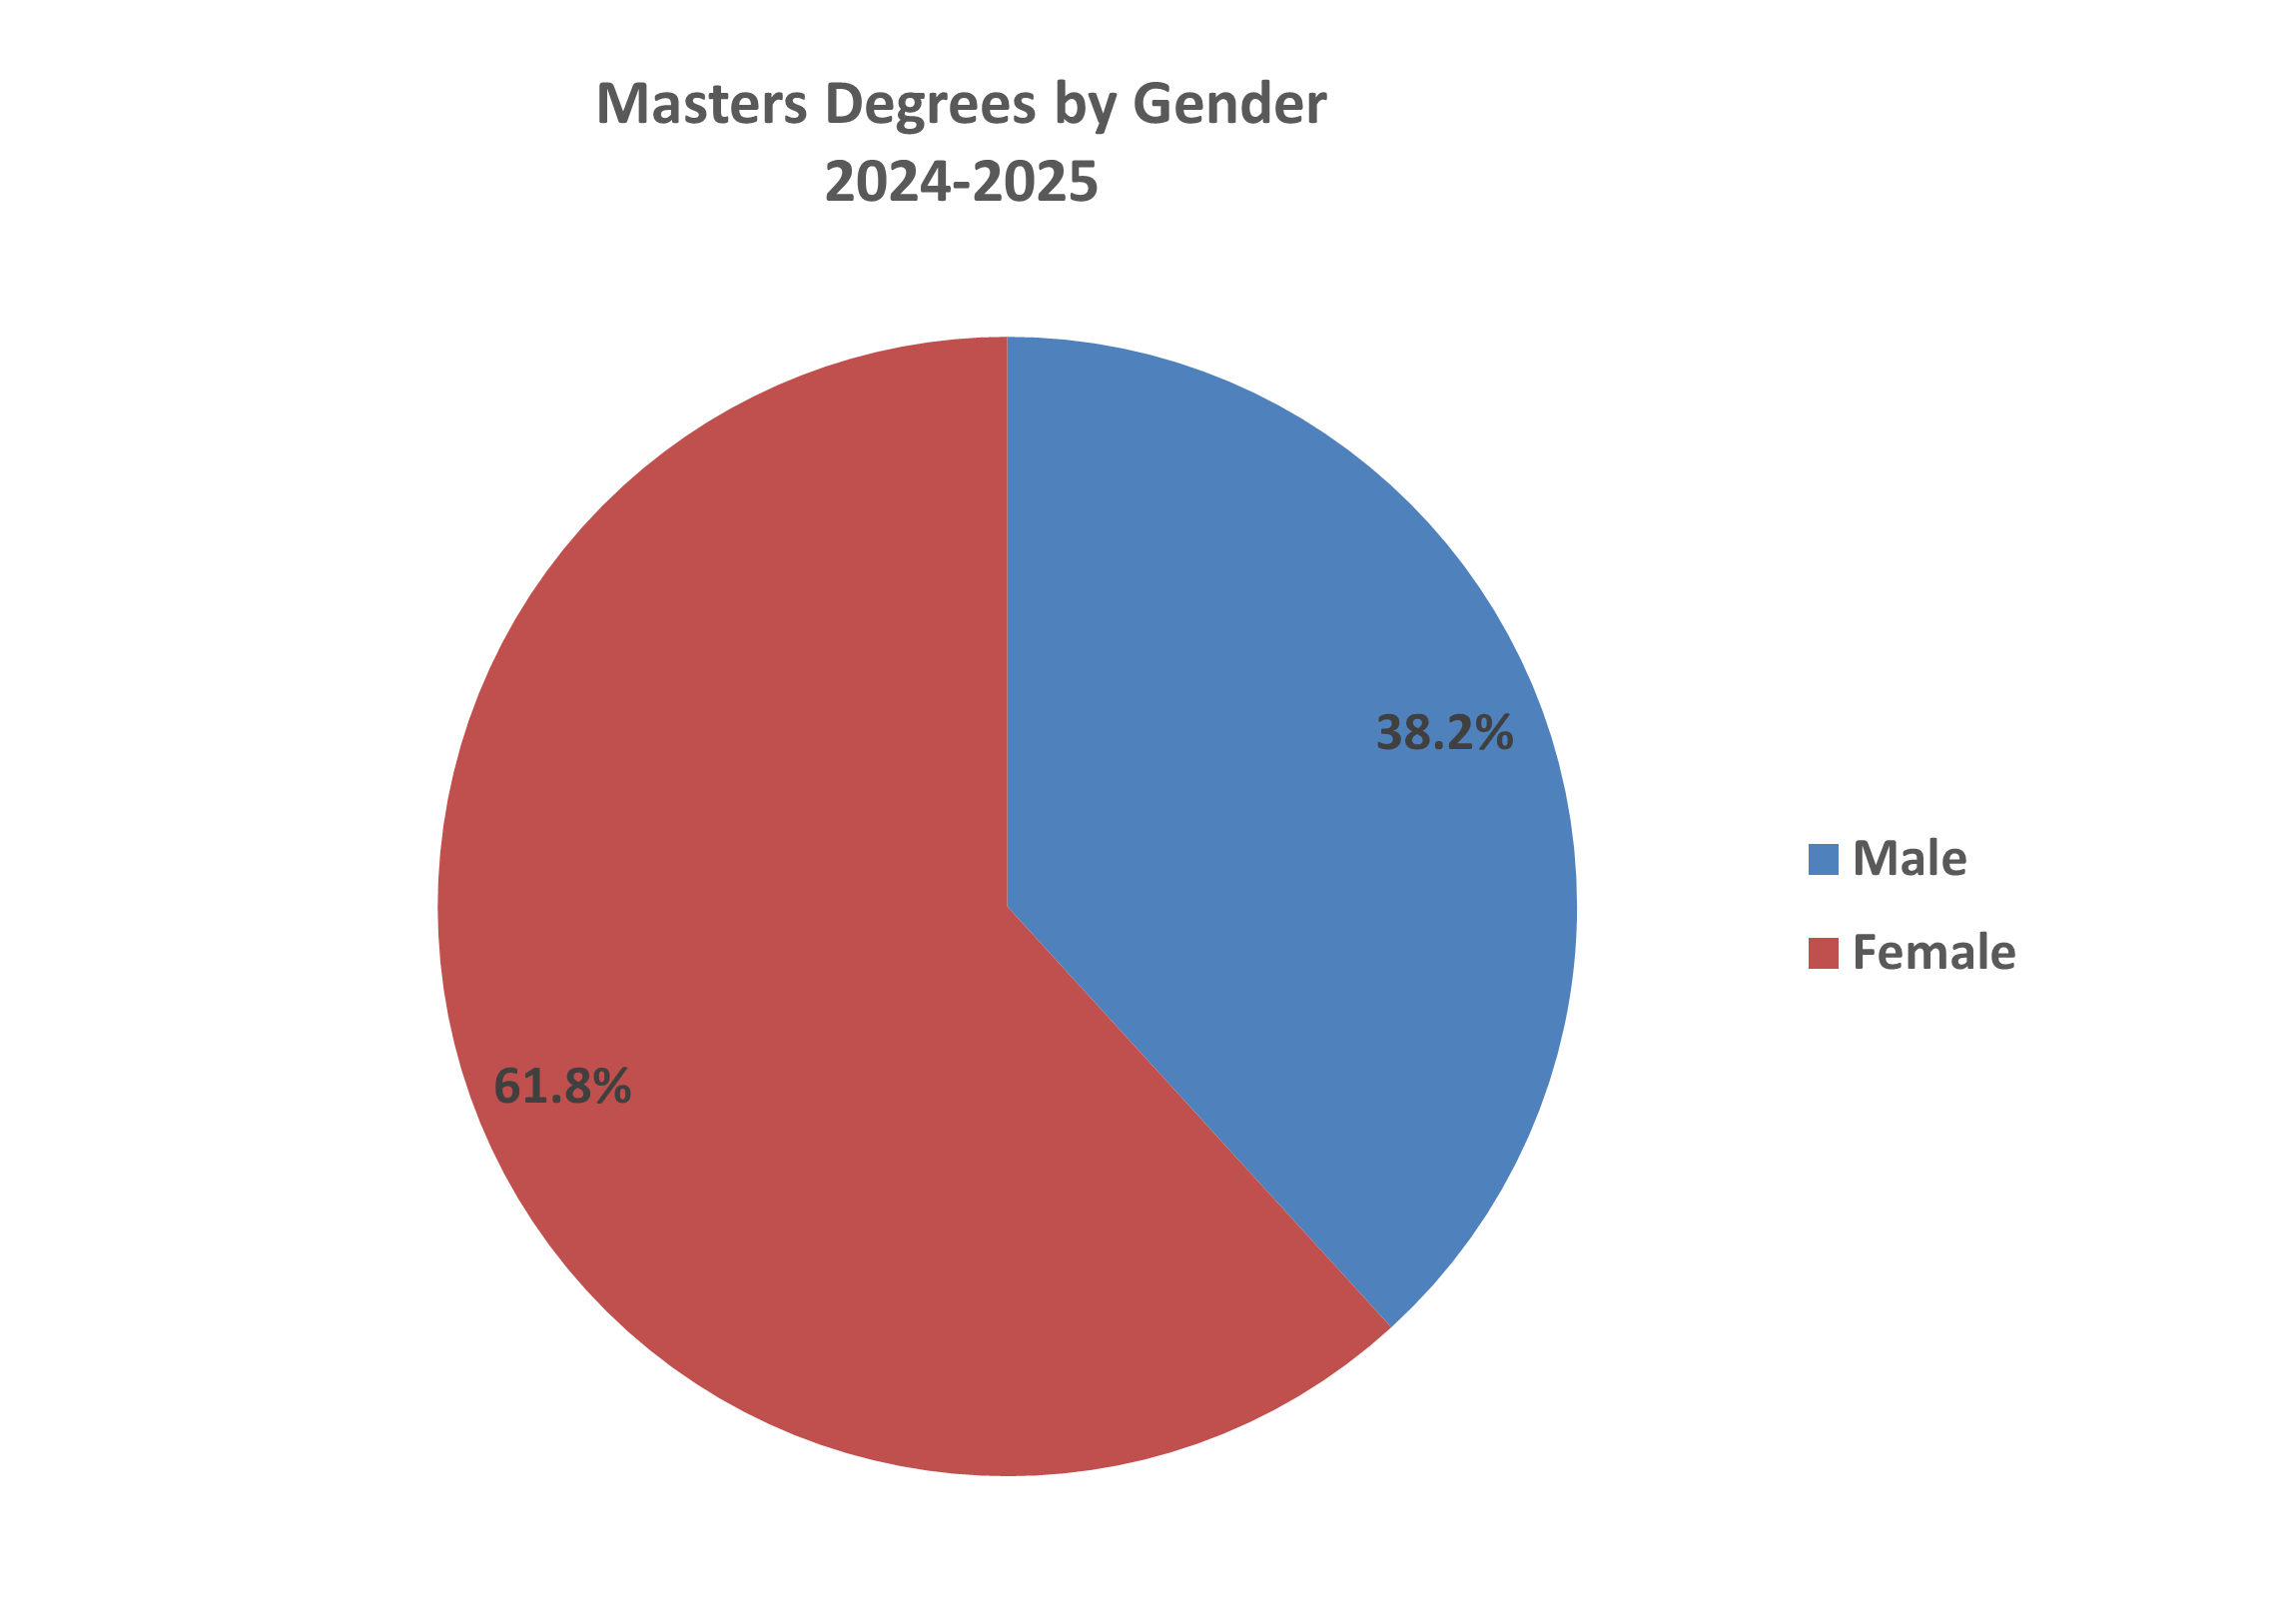
| Total Males | 217 | 100.0% | 230 | 100.0% | 217 | 100.0% | 168 | 100.0% | 177 | 100.0% | 5.4% |
Overall
| Ethnicity | 2020 - 2021 | 2021 - 2022 | 2022 - 2023 | 2023 - 2024 | 2024 - 2025 | % change from Previous Year |
|||||
|---|---|---|---|---|---|---|---|---|---|---|---|
| American Indian or Alaska Native | 1 | 0.2% | 1 | 0.2% | 0 | 0.0% | 1 | 0.2% | 1 | 0.2% | 0.0% |
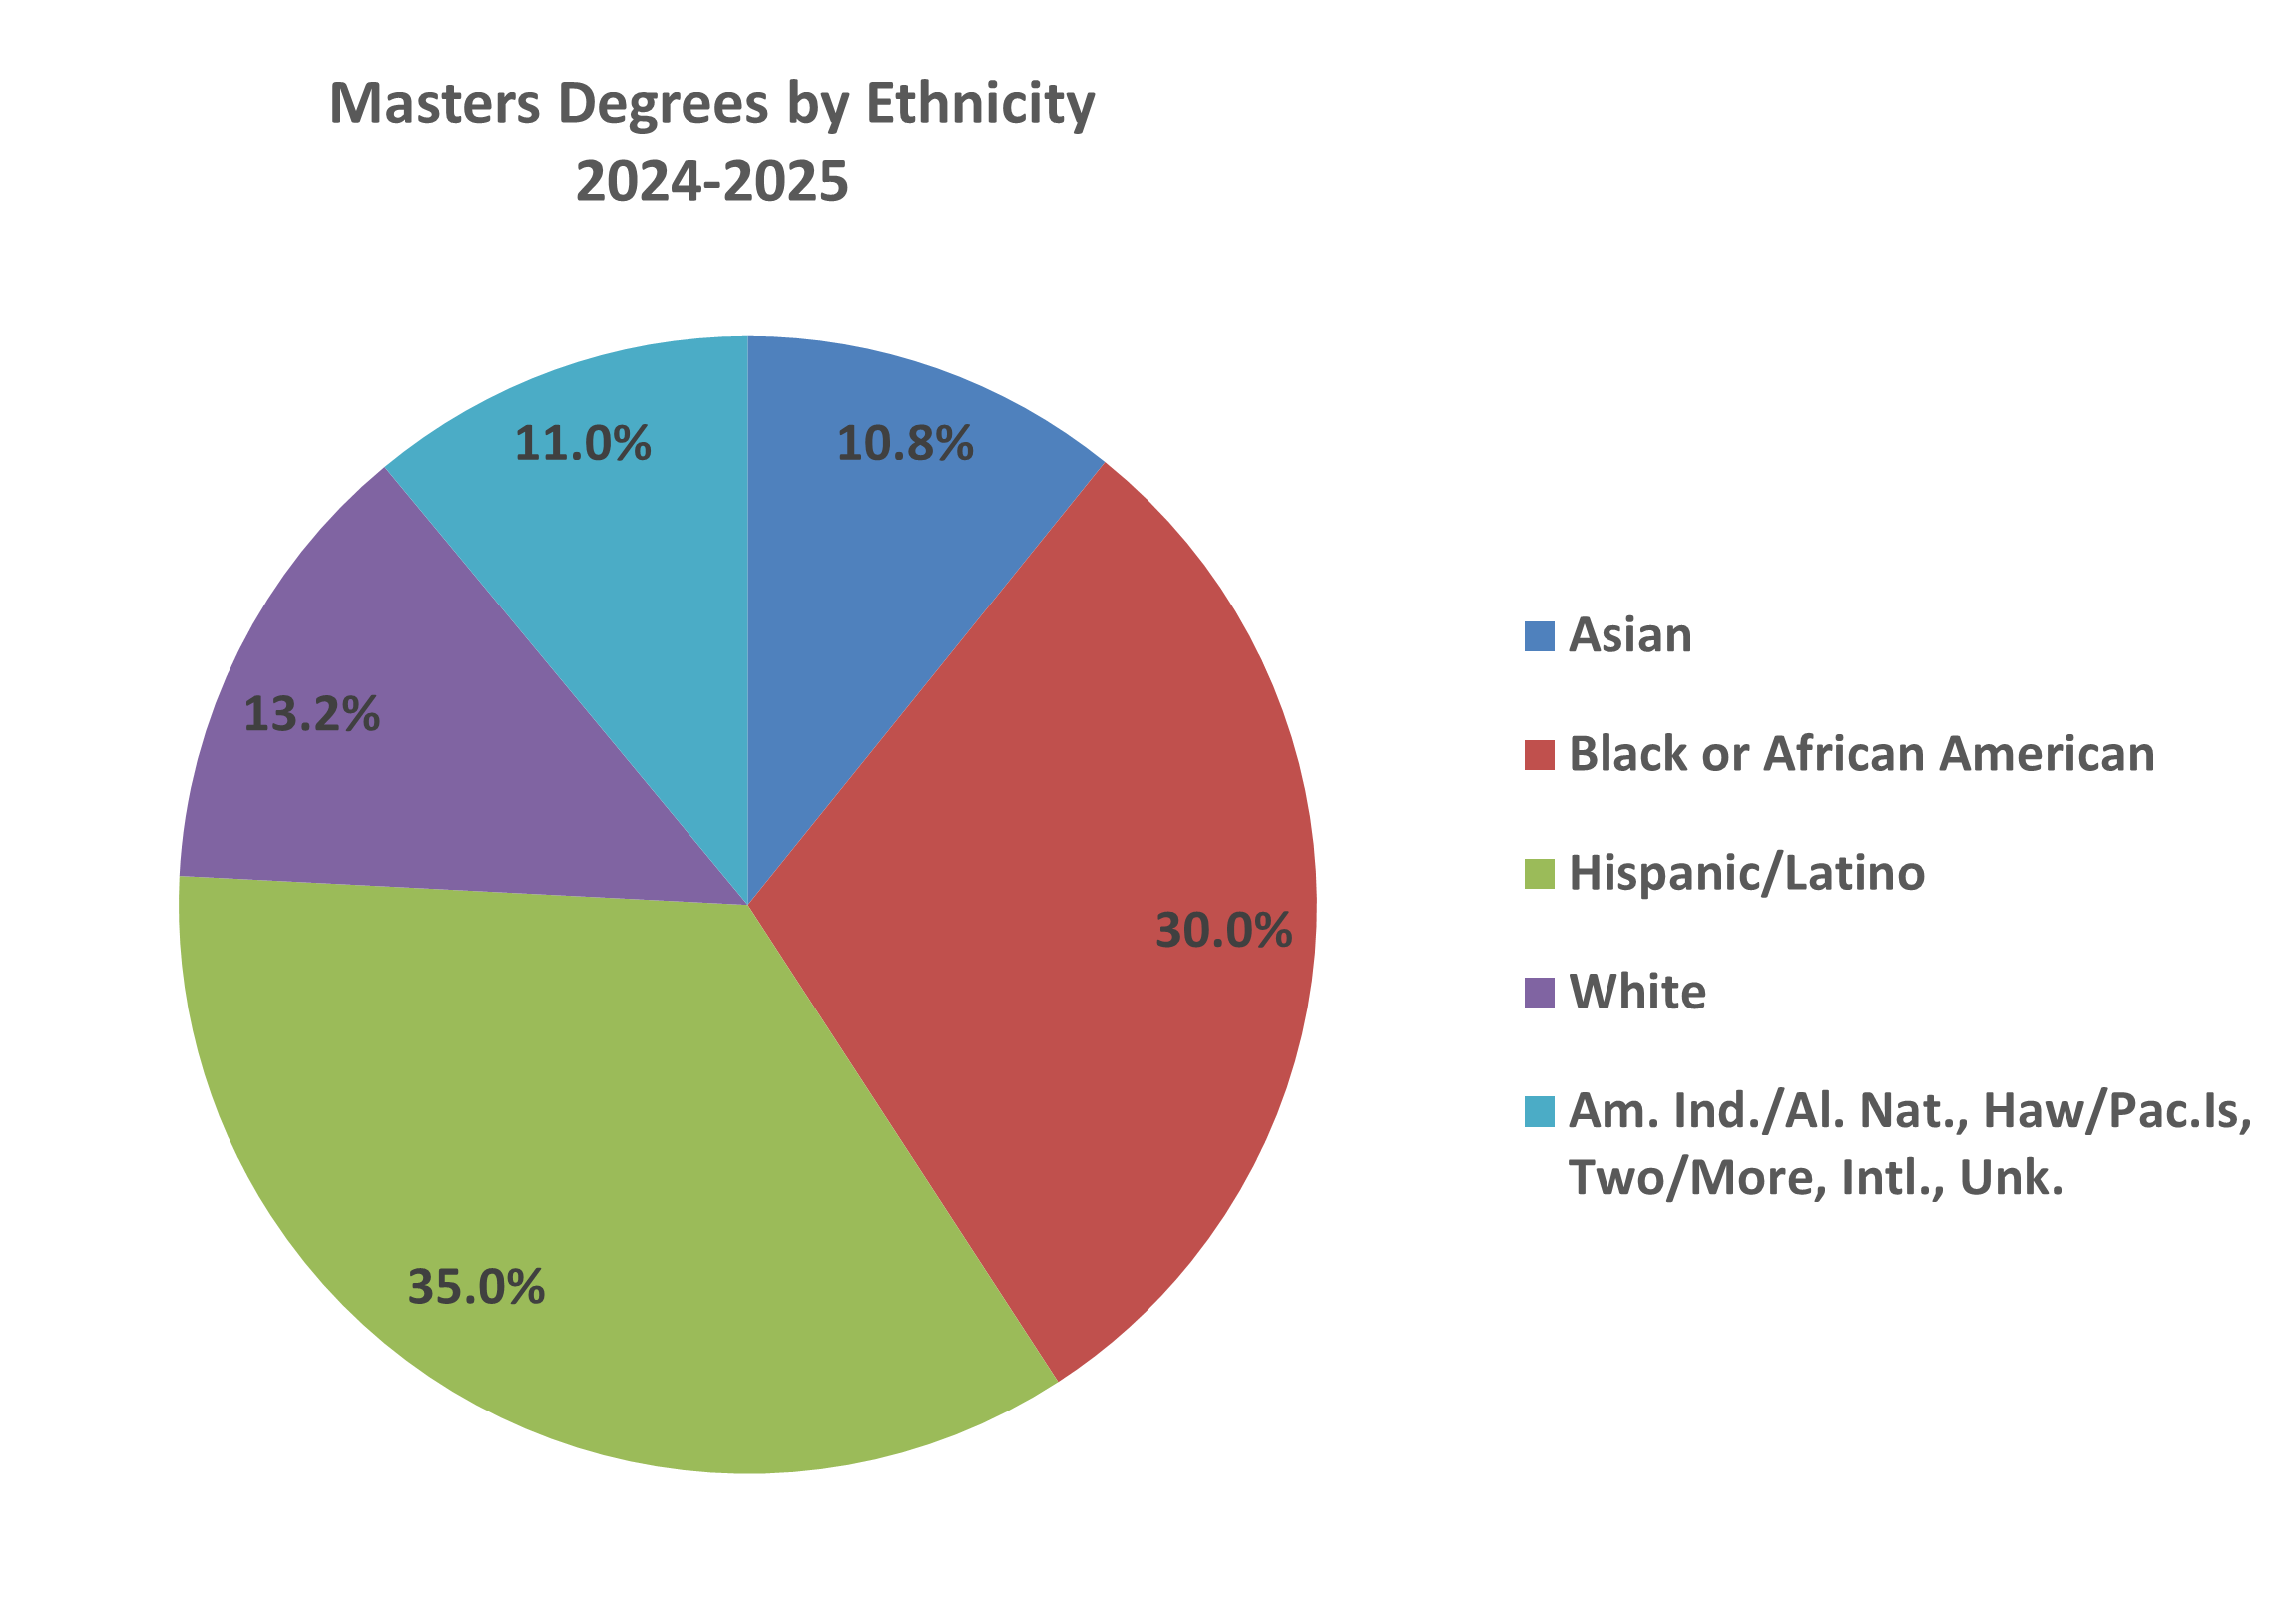
| Asian | 63 | 12.3% | 70 | 12.1% | 57 | 11.1% | 53 | 11.9% | 50 | 10.8% | -5.7% |
| Black or African American | 153 | 29.8% | 188 | 32.4% | 144 | 28.0% | 121 | 27.1% | 139 | 30.0% | 14.9% |
| Hispanic/Latino | 136 | 26.5% | 189 | 32.6% | 185 | 36.0% | 172 | 38.5% | 162 | 35.0% | -5.8% |
| White | 124 | 24.1% | 83 | 14.3% | 81 | 15.8% | 62 | 13.9% | 61 | 13.2% | -1.6% |
| Native Hawaiian or Other Pacific Islander | 1 | 0.2% | 0 | 0.0% | 0 | 0.0% | 0 | 0.0% | 1 | 0.2% | - |
| Two or More Races | 10 | 1.9% | 18 | 3.1% | 16 | 3.1% | 12 | 2.7% | 13 | 2.8% | 8.3% |
| International | 22 | 4.3% | 27 | 4.7% | 29 | 5.6% | 24 | 5.4% | 32 | 6.9% | 33.3% |
| Race and ethnicity unknown | 4 | 0.8% | 4 | 0.7% | 2 | 0.4% | 2 | 0.4% | 4 | 0.9% | 100.0% |
| Grand Total | 514 | 100.0% | 580 | 100.0% | 514 | 100.0% | 447 | 100.0% | 463 | 100.0% | 3.6% |
Source: CBM009 Report