UHD / Office of the Provost / Office of Institutional Effectiveness / Office of Data Analytics & Institutional Research / Total Student Headcount Enrollment by Gender & Ethnicity
Total Student Headcount Enrollment by Gender & Ethnicity
*This page is best viewed in landscape mode
FemaleMaleOverallBack to Fact Book Home
(Includes Undergraduate and Graduate Students)
Female
| Ethnicity | Fall 2021 | Fall 2022 | Fall 2023 | Fall 2024 | Fall 2025 | % change from Previous Year |
|||||
|---|---|---|---|---|---|---|---|---|---|---|---|
| American Indian or Alaska Native | 8 | 0.1% | 7 | 0.1% | 8 | 0.1% | 7 | 0.1% | 7 | 0.1% | 0.0% |
| Asian | 592 | 6.2% | 570 | 6.4% | 572 | 6.6% | 540 | 6.3% | 481 | 5.8% | -10.9% |
| Black or African American | 2,025 | 21.2% | 1,831 | 20.5% | 1,705 | 19.5% | 1,689 | 19.8% | 1,680 | 20.1% | -0.5% |
| Hispanic/Latino | 5,356 | 56.1% | 5,159 | 57.7% | 5,120 | 58.7% | 5,072 | 59.5% | 4,936 | 59.1% | -2.7% |
| White | 1,074 | 11.3% | 931 | 10.4% | 875 | 10.0% | 791 | 9.3% | 698 | 8.4% | -11.8% |
| Native Hawaiian or Other Pacific Islander | 3 | 0.0% | 6 | 0.1% | 7 | 0.1% | 10 | 0.1% | 9 | 0.1% | -10.0% |
| Two or More Races | 257 | 2.7% | 209 | 2.3% | 213 | 2.4% | 197 | 2.3% | 206 | 2.5% | 4.6% |
| International | 180 | 1.9% | 175 | 2.0% | 153 | 1.8% | 143 | 1.7% | 149 | 1.8% | 4.2% |
| Race and ethnicity unknown | 51 | 0.5% | 47 | 0.5% | 72 | 0.8% | 81 | 0.9% | 188 | 2.3% | 132.1% |
| Total Females | 9,546 | 100.0% | 8,935 | 100.0% | 8,725 | 100.0% | 8,530 | 100.0% | 8,354 | 100.0% | -2.1% |
Male
| Ethnicity | Fall 2021 | Fall 2022 | Fall 2023 | Fall 2024 | Fall 2025 | % change from Previous Year |
|||||
|---|---|---|---|---|---|---|---|---|---|---|---|
| American Indian or Alaska Native | 10 | 0.2% | 8 | 0.2% | 6 | 0.1% | 4 | 0.1% | 1 | 0.0% | -75.0% |
| Asian | 673 | 12.2% | 645 | 12.2% | 616 | 11.4% | 603 | 11.6% | 566 | 10.9% | -6.1% |
| Black or African American | 962 | 17.4% | 843 | 16.0% | 821 | 15.3% | 837 | 16.1% | 867 | 16.7% | 3.6% |
| Hispanic/Latino | 2,702 | 48.9% | 2,710 | 51.4% | 2,853 | 53.0% | 2,808 | 54.0% | 2,821 | 54.2% | 0.5% |
| White | 833 | 15.1% | 739 | 14.0% | 729 | 13.6% | 624 | 12.0% | 567 | 10.9% | -9.1% |
| Native Hawaiian or Other Pacific Islander | 4 | 0.1% | 2 | 0.0% | 6 | 0.1% | 4 | 0.1% | 2 | 0.0% | -50.0% |
| Two or More Races | 138 | 2.5% | 129 | 2.4% | 143 | 2.7% | 129 | 2.5% | 137 | 2.6% | 6.2% |
| International | 175 | 3.2% | 161 | 3.1% | 155 | 2.9% | 137 | 2.6% | 132 | 2.5% | -3.6% |
| Race and ethnicity unknown | 34 | 0.6% | 36 | 0.7% | 51 | 0.9% | 54 | 1.0% | 111 | 2.1% | 105.6% |
| Total Males | 5,531 | 100.0% | 5,273 | 100.0% | 5,380 | 100.0% | 5,200 | 100.0% | 5,204 | 100.0% | 0.1% |
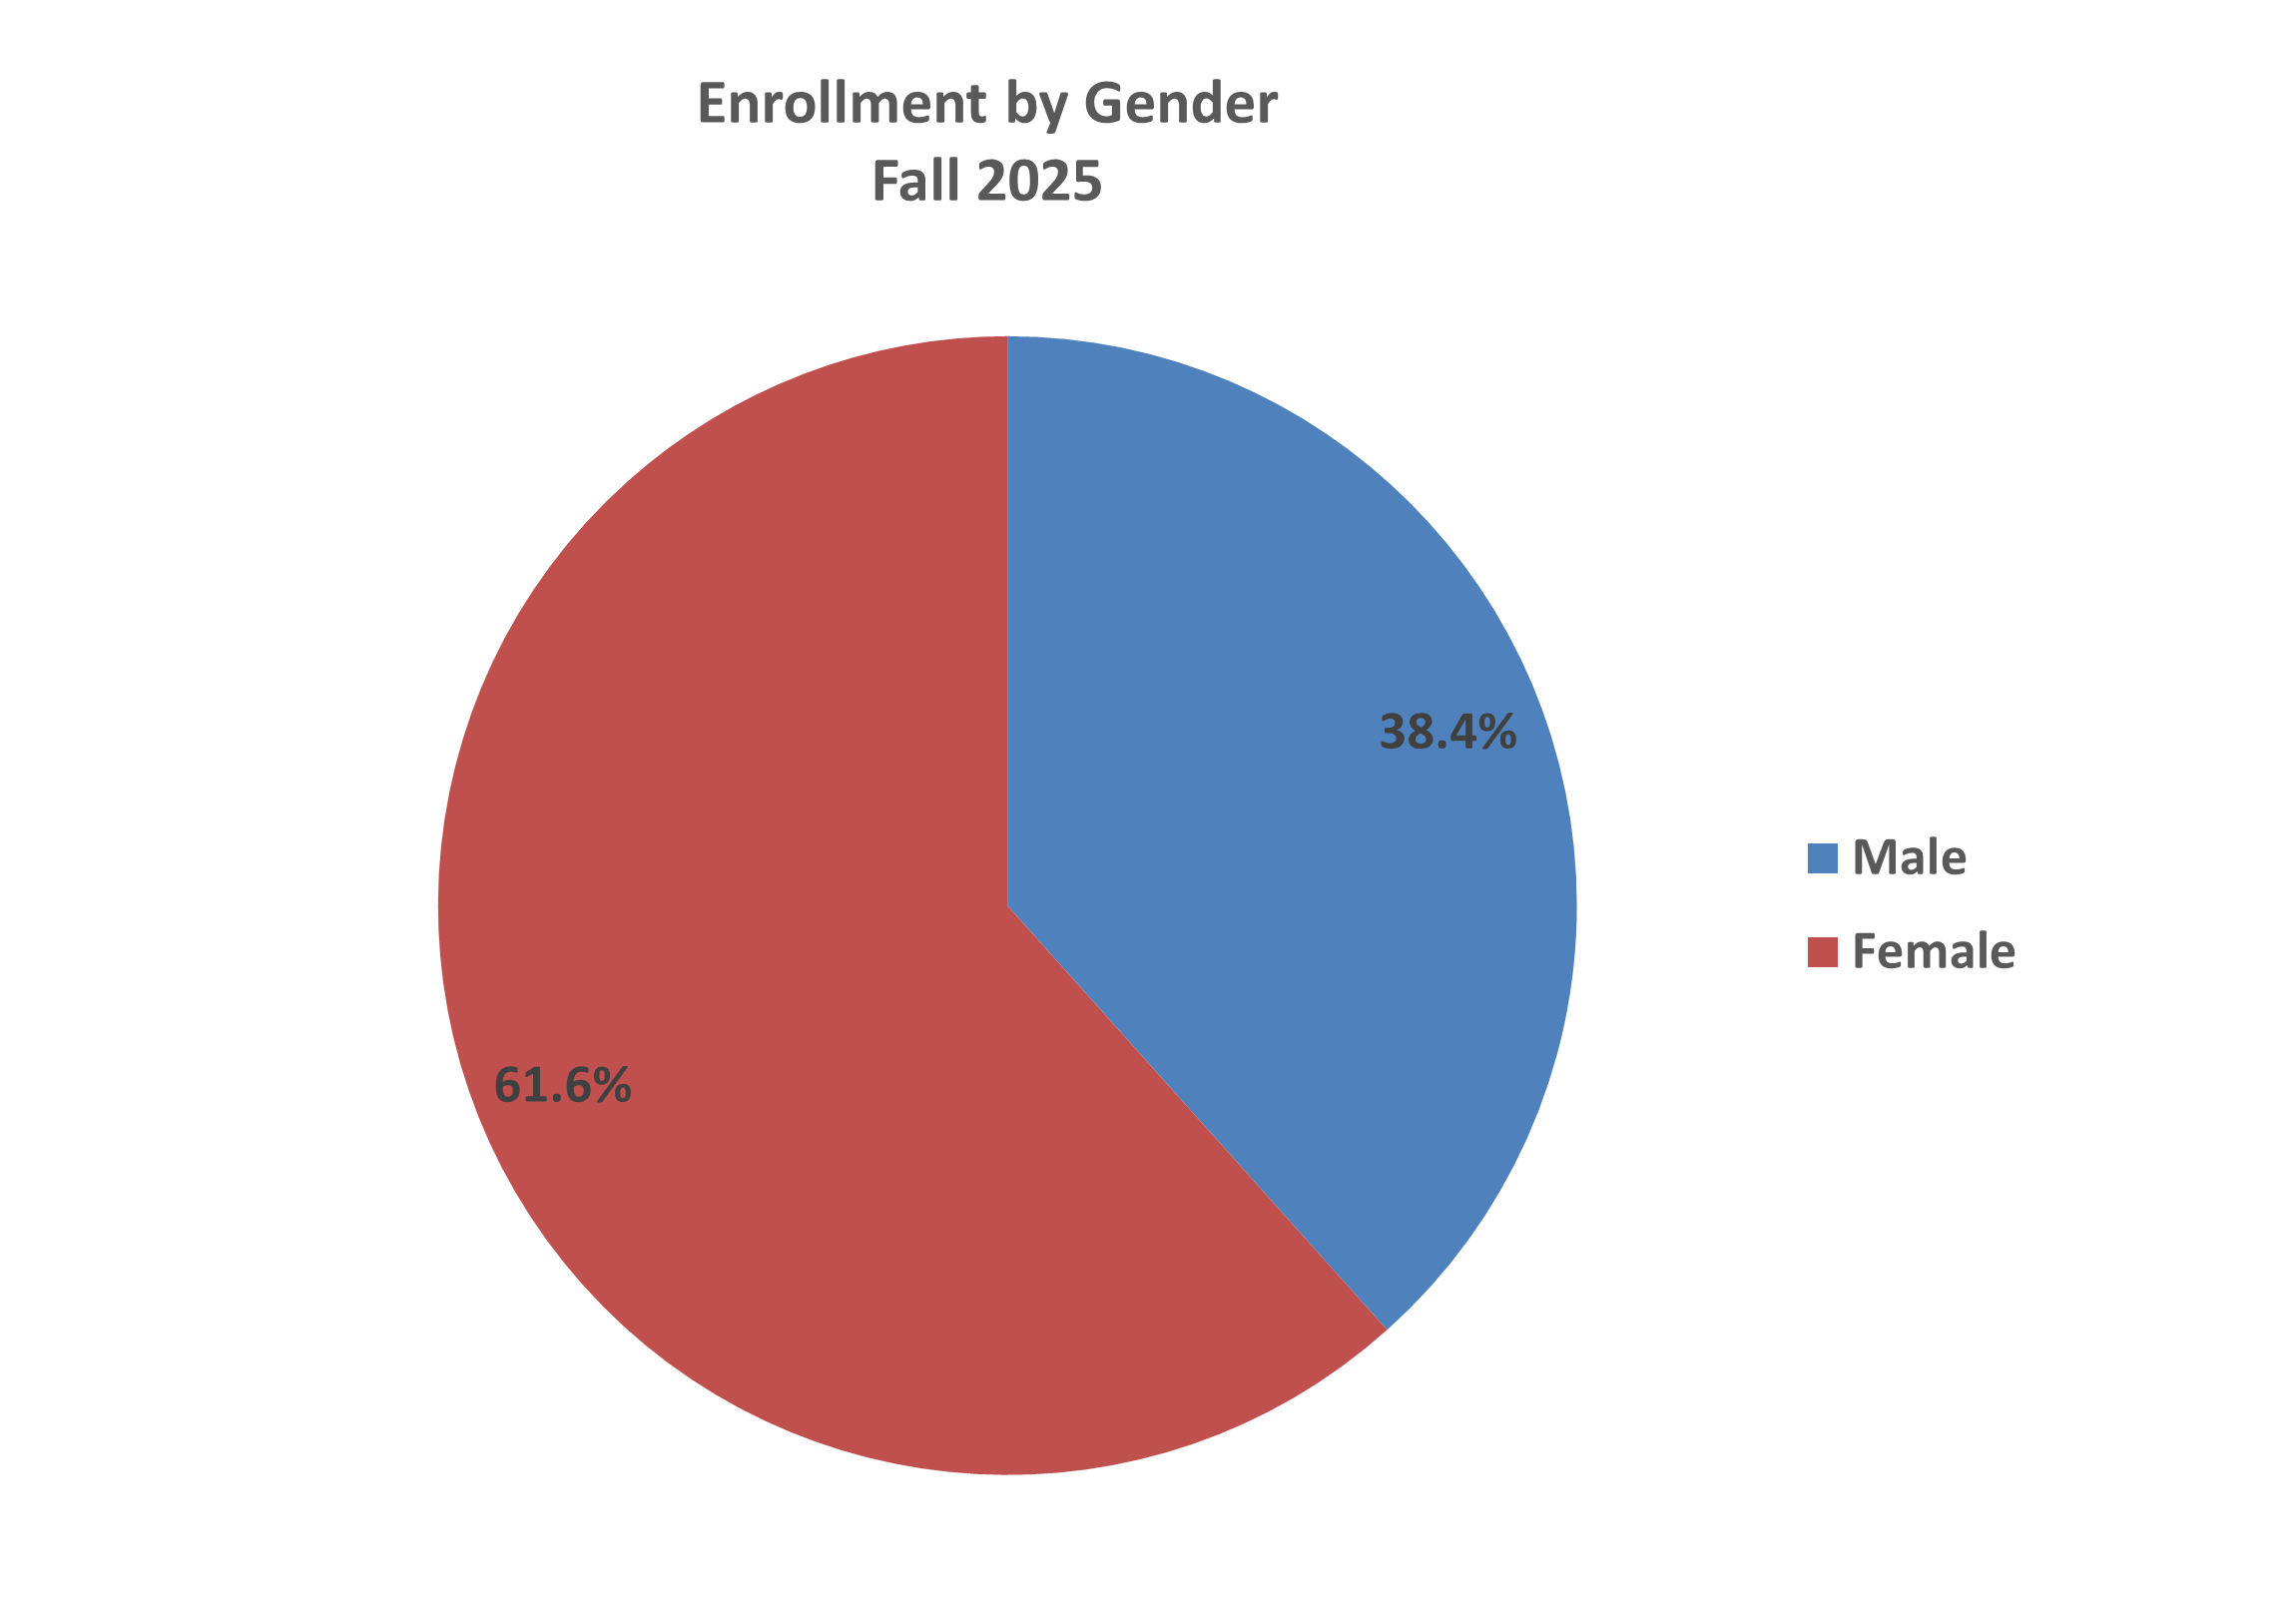
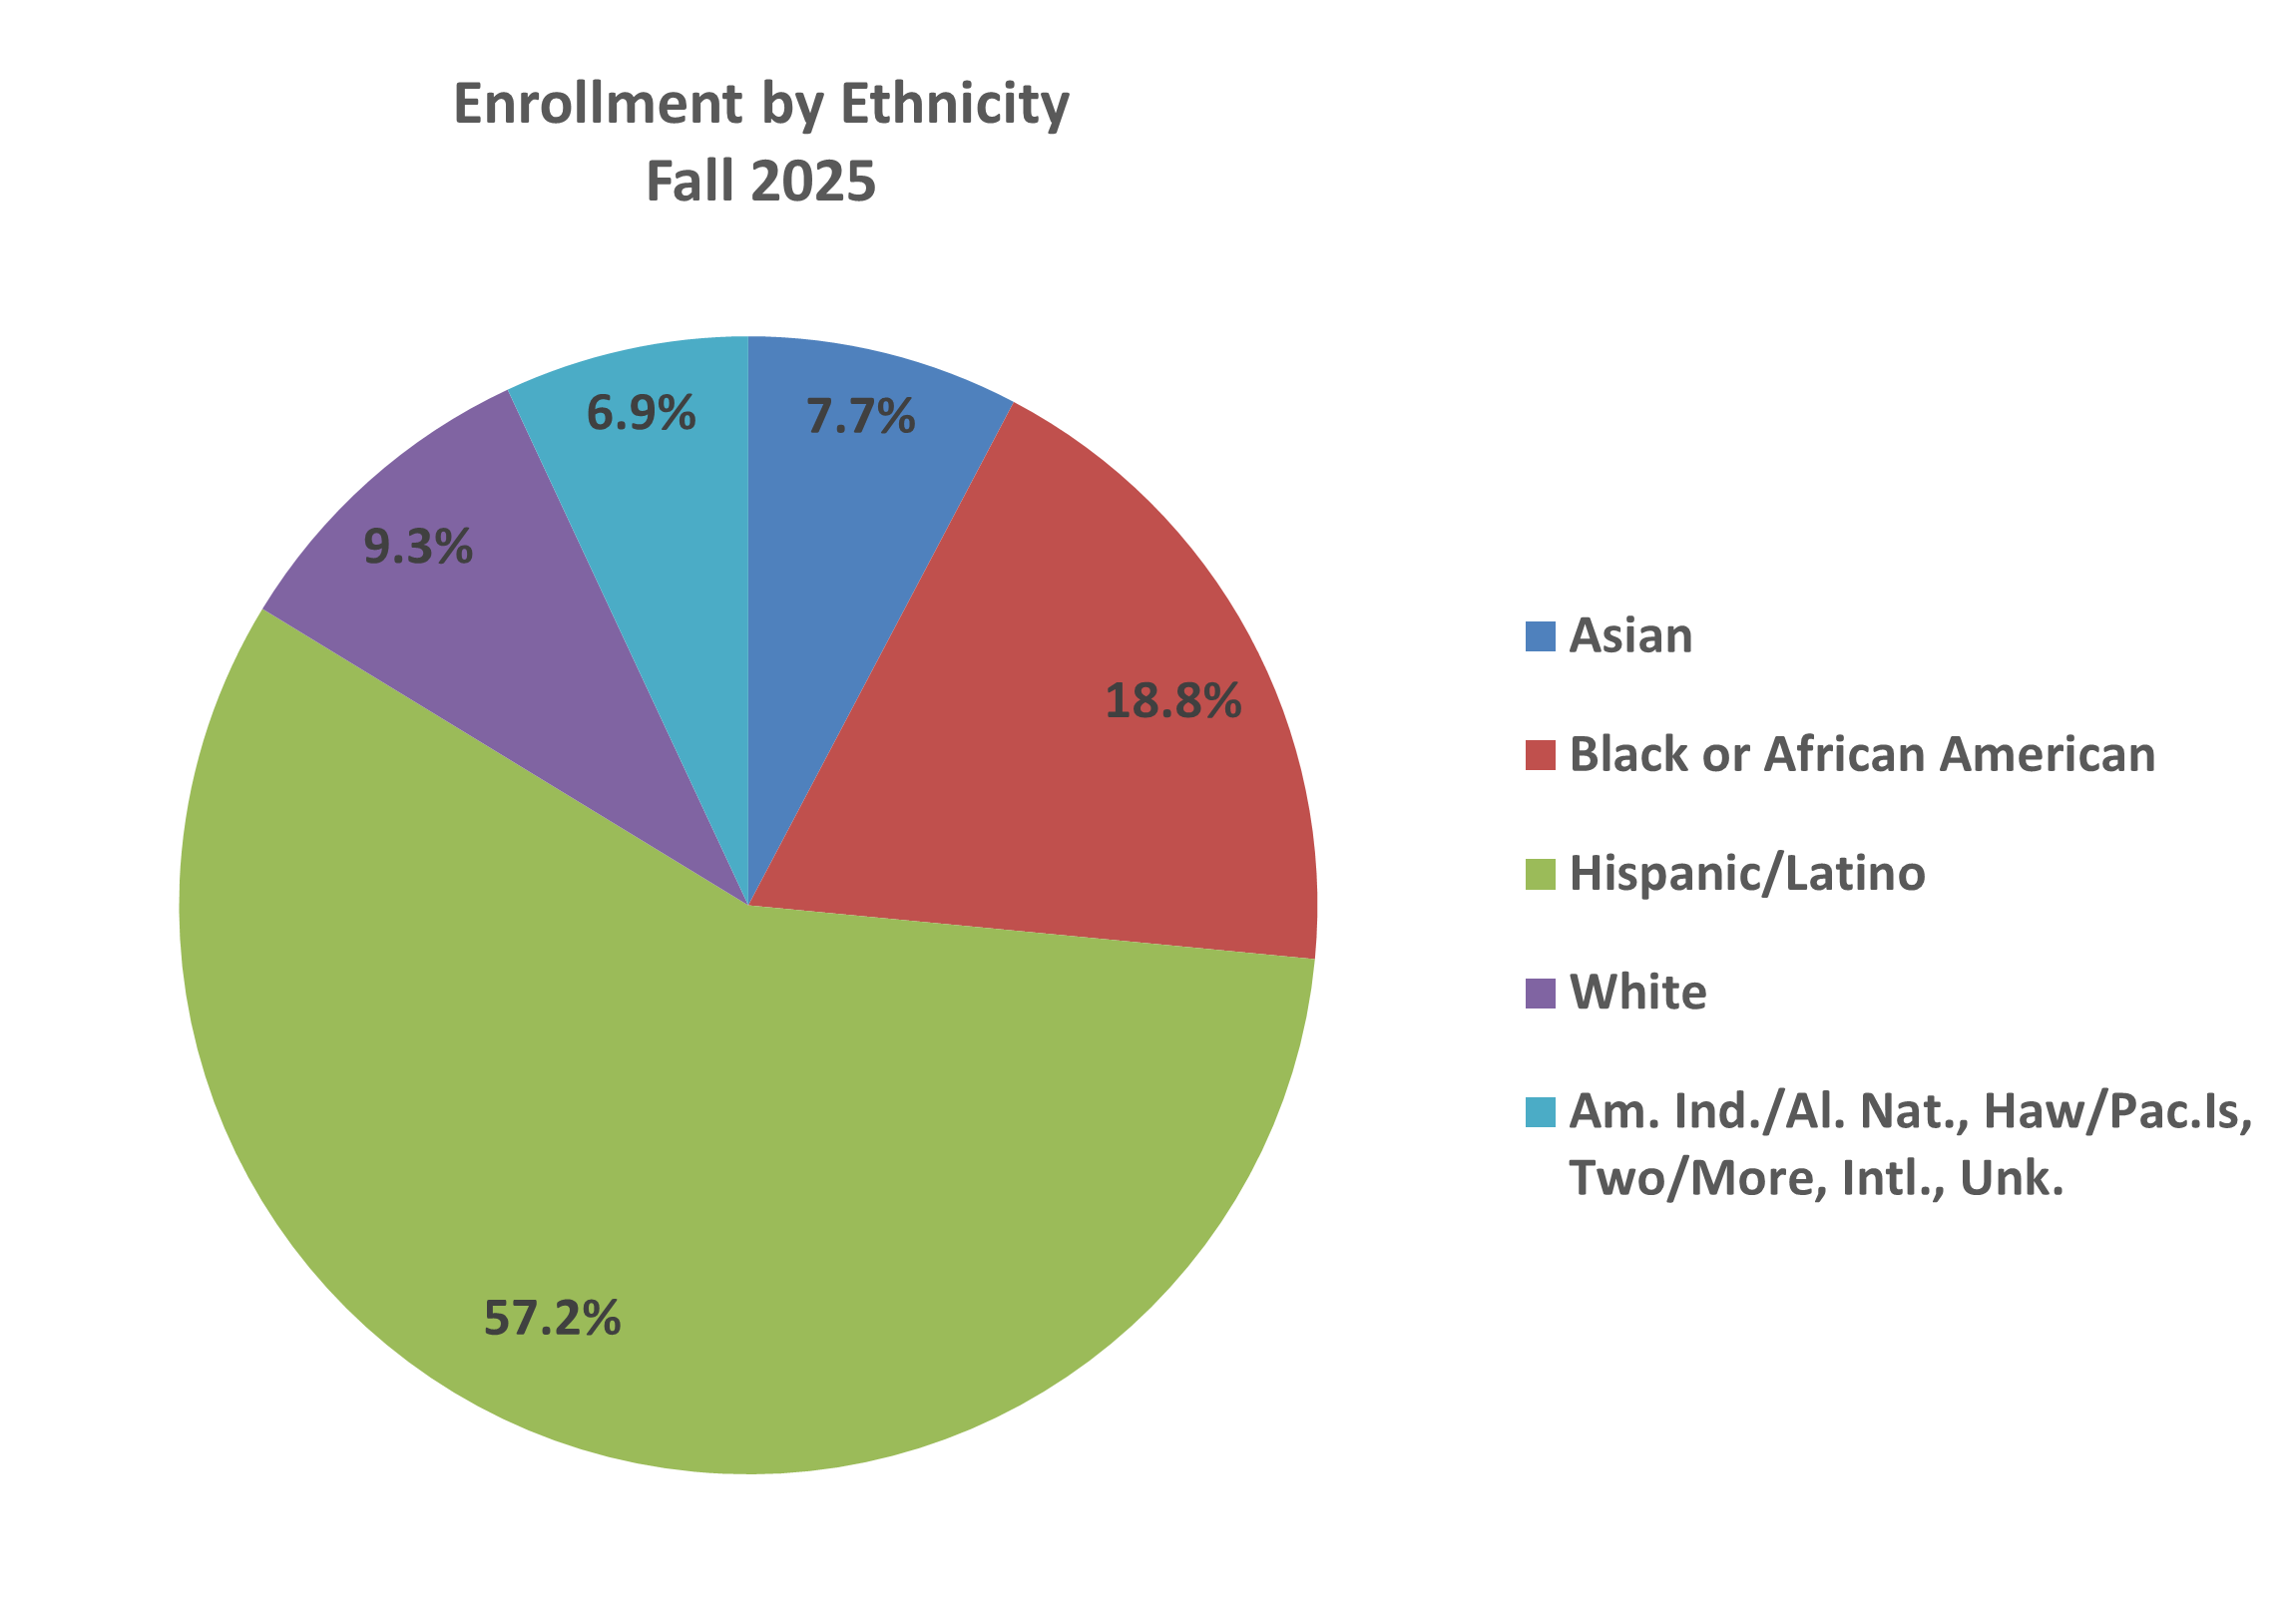
Overall
| Ethnicity | Fall 2021 | Fall 2022 | Fall 2023 | Fall 2024 | Fall 2025 | % change from Previous Year |
|||||
|---|---|---|---|---|---|---|---|---|---|---|---|
| American Indian or Alaska Native | 18 | 0.1% | 15 | 0.1% | 14 | 0.1% | 11 | 0.1% | 8 | 0.1% | -27.3% |
| Asian | 1,265 | 8.4% | 1,215 | 8.6% | 1,188 | 8.4% | 1,143 | 8.3% | 1,047 | 7.7% | -8.4% |
| Black or African American | 2,987 | 19.8% | 2,674 | 18.8% | 2,526 | 17.9% | 2,526 | 18.4% | 2,547 | 18.8% | 0.8% |
| Hispanic/Latino | 8,058 | 53.4% | 7,869 | 55.4% | 7,973 | 56.5% | 7,880 | 57.4% | 7,757 | 57.2% | -1.6% |
| White | 1,907 | 12.6% | 1,670 | 11.8% | 1,604 | 11.4% | 1,415 | 10.3% | 1,265 | 9.3% | -10.6% |
| Native Hawaiian or Other Pacific Islander | 7 | 0.0% | 8 | 0.1% | 13 | 0.1% | 14 | 0.1% | 11 | 0.1% | -21.4% |
| Two or More Races | 395 | 2.6% | 338 | 2.4% | 356 | 2.5% | 326 | 2.4% | 343 | 2.5% | 5.2% |
| International | 355 | 2.4% | 336 | 2.4% | 308 | 2.2% | 280 | 2.0% | 281 | 2.1% | 0.4% |
| Race and ethnicity unknown | 85 | 0.6% | 83 | 0.6% | 123 | 0.9% | 135 | 1.0% | 299 | 2.2% | 121.5% |
| Total | 15,077 | 100.0% | 14,208 | 100.0% | 14,105 | 100.0% | 13,730 | 100.0% | 13,558 | 100.0% | -1.3% |