UHD / Office of the Provost / Office of Institutional Effectiveness / Office of Data Analytics & Institutional Research / Total Student Enrollment by Classification
Total Student Enrollment by Classification
*This page is best viewed in landscape mode
Enrollment by Classification
| Classification | Fall 2021 | Fall 2022 | Fall 2023 | Fall 2024 | Fall 2025 | % change from Previous Year |
|||||
|---|---|---|---|---|---|---|---|---|---|---|---|
| Freshman | 1,930 | 12.8% | 2,030 | 14.3% | 2,166 | 15.4% | 1,850 | 13.5% | 1,657 | 12.2% | -10.4% |
| Sophomore | 1,562 | 10.4% | 1,380 | 9.7% | 1,511 | 10.7% | 1,556 | 11.3% | 1,620 | 11.9% | 4.1% |
| Junior | 3,663 | 24.3% | 3,548 | 25.0% | 3,537 | 25.1% | 3,643 | 26.5% | 3,461 | 25.5% | -5.0% |
| Senior | 6,194 | 41.1% | 5,663 | 39.9% | 5,457 | 38.7% | 5,337 | 38.9% | 5,468 | 40.3% | 2.5% |
| Post Bac | 263 | 1.7% | 235 | 1.7% | 209 | 1.5% | 236 | 1.7% | 235 | 1.7% | -0.4% |
| Graduate Student | 1,465 | 9.7% | 1,352 | 9.5% | 1,225 | 8.7% | 1,108 | 8.1% | 1,117 | 8.2% | 0.8% |
| Total | 15,077 | 100.0% | 14,208 | 100.0% | 14,105 | 100.0% | 13,730 | 100.0% | 13,558 | 100.0% | -1.3% |
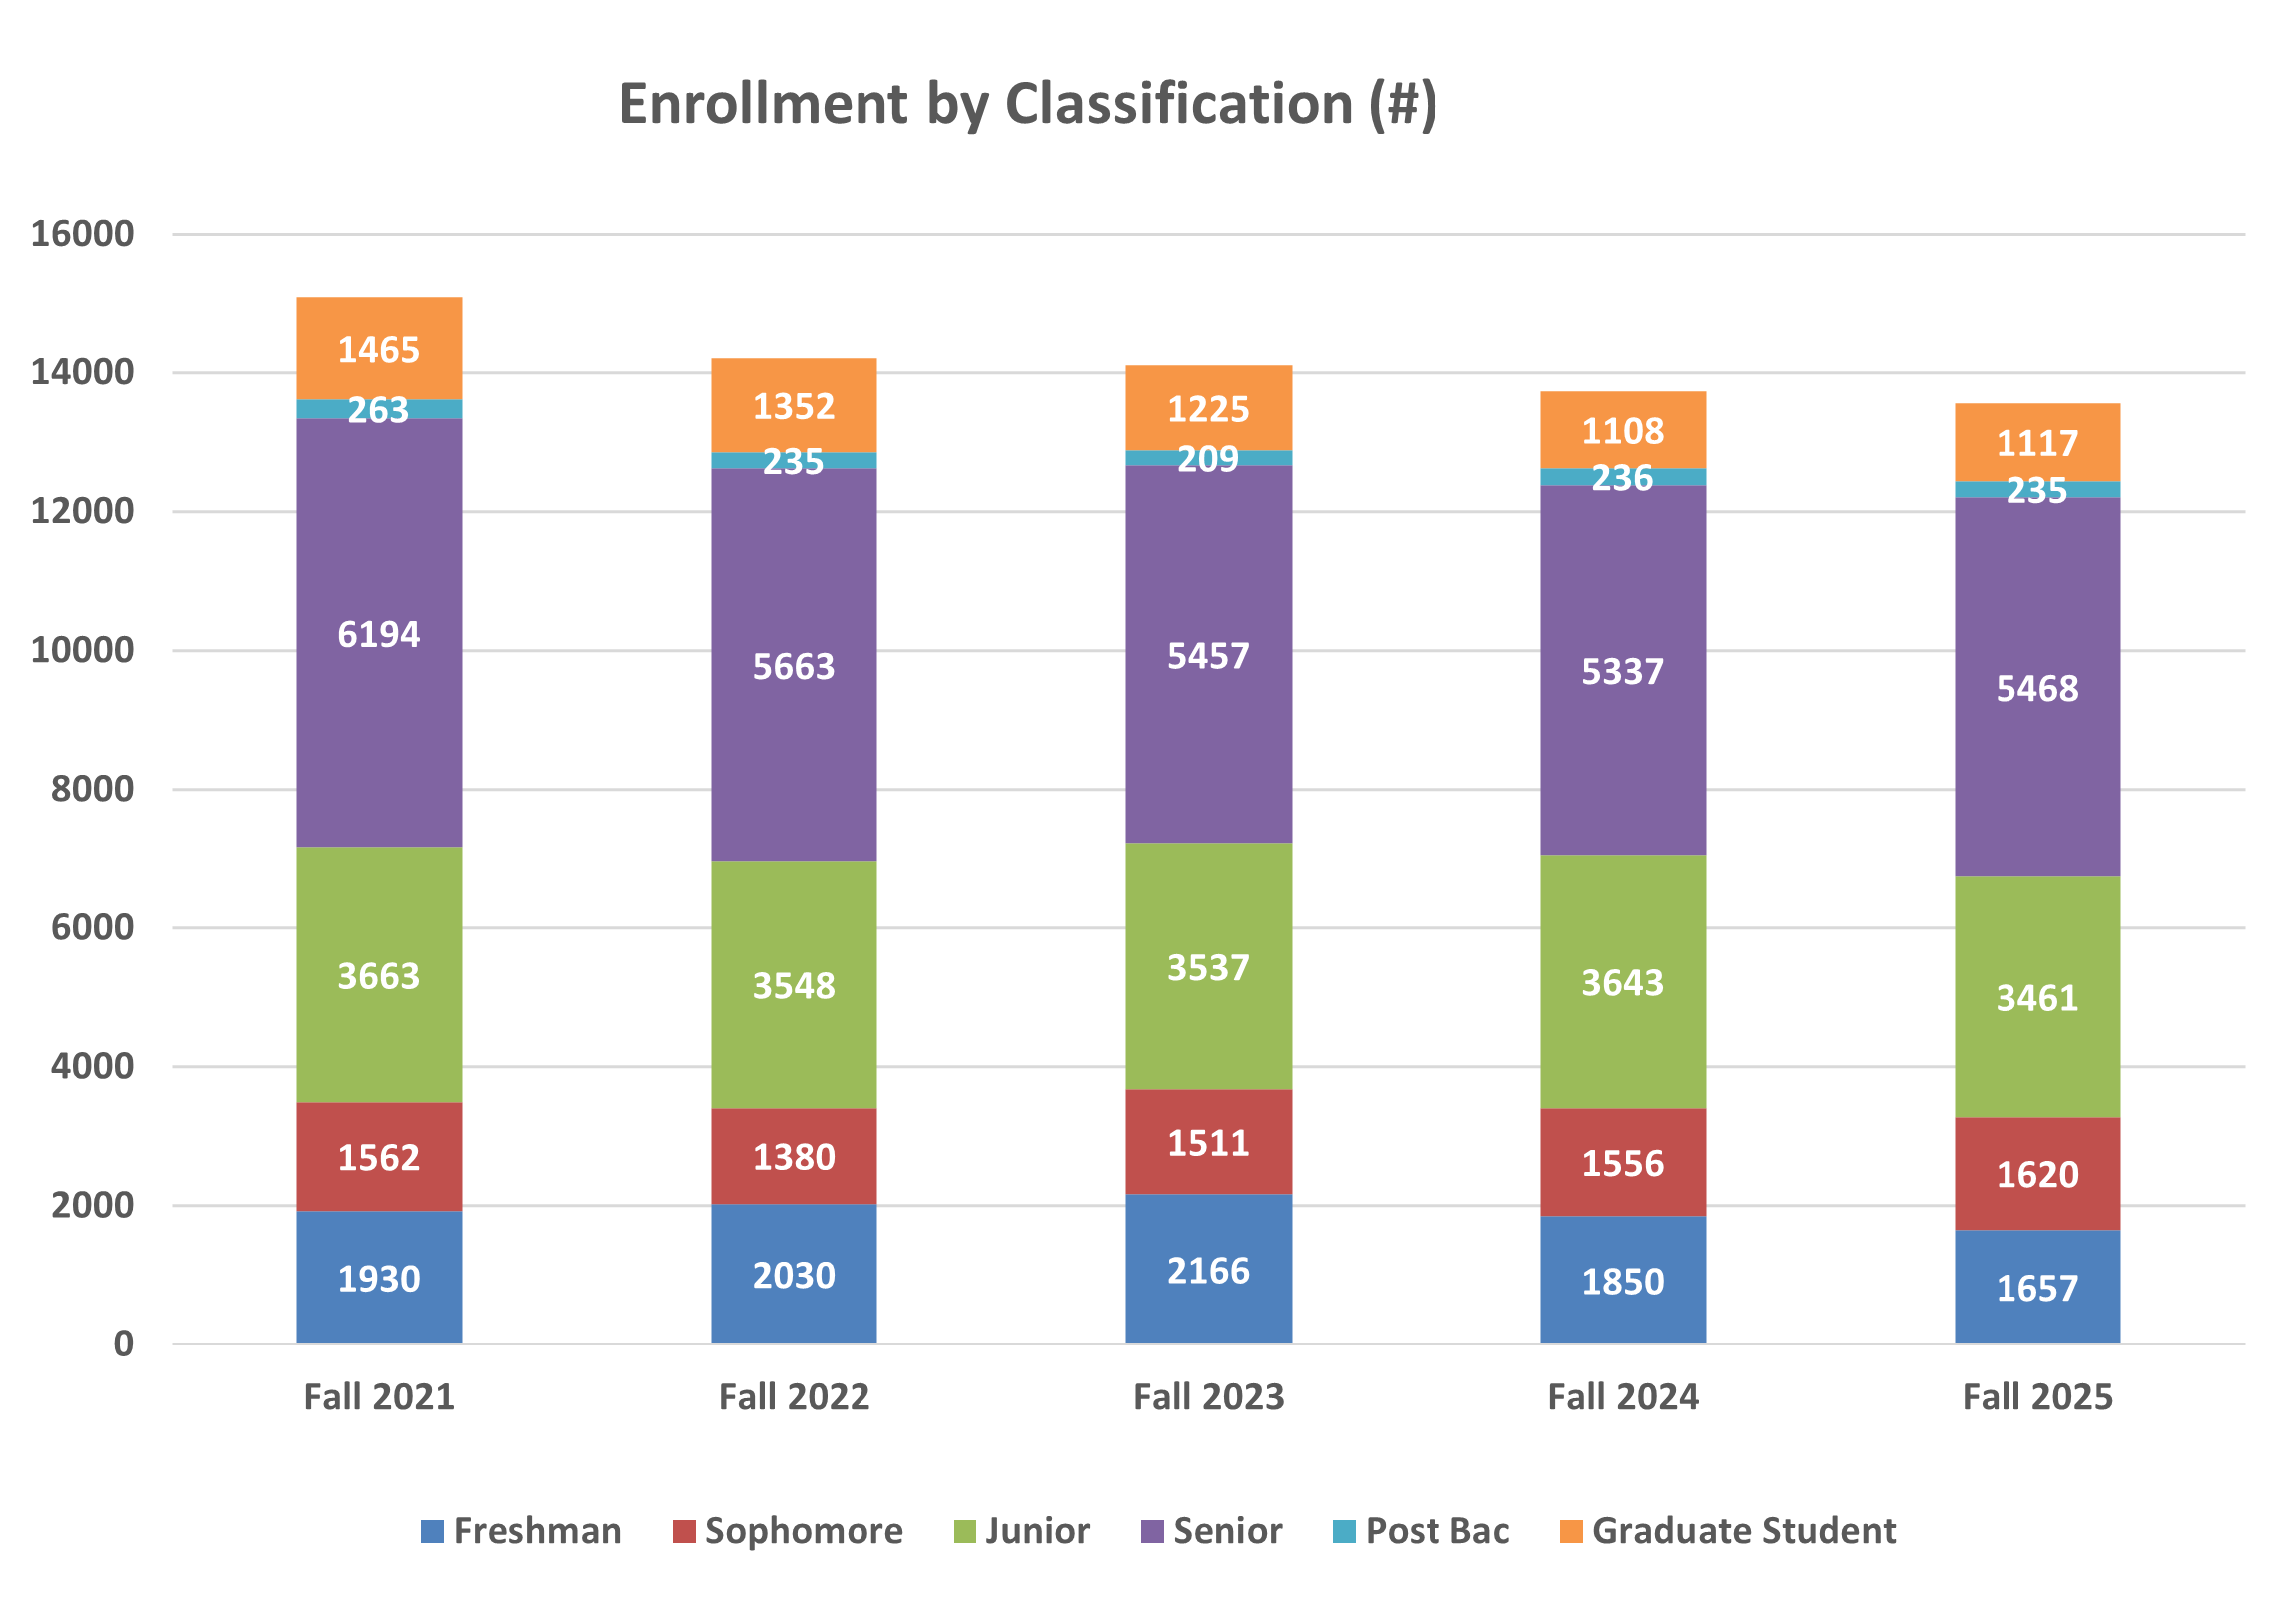
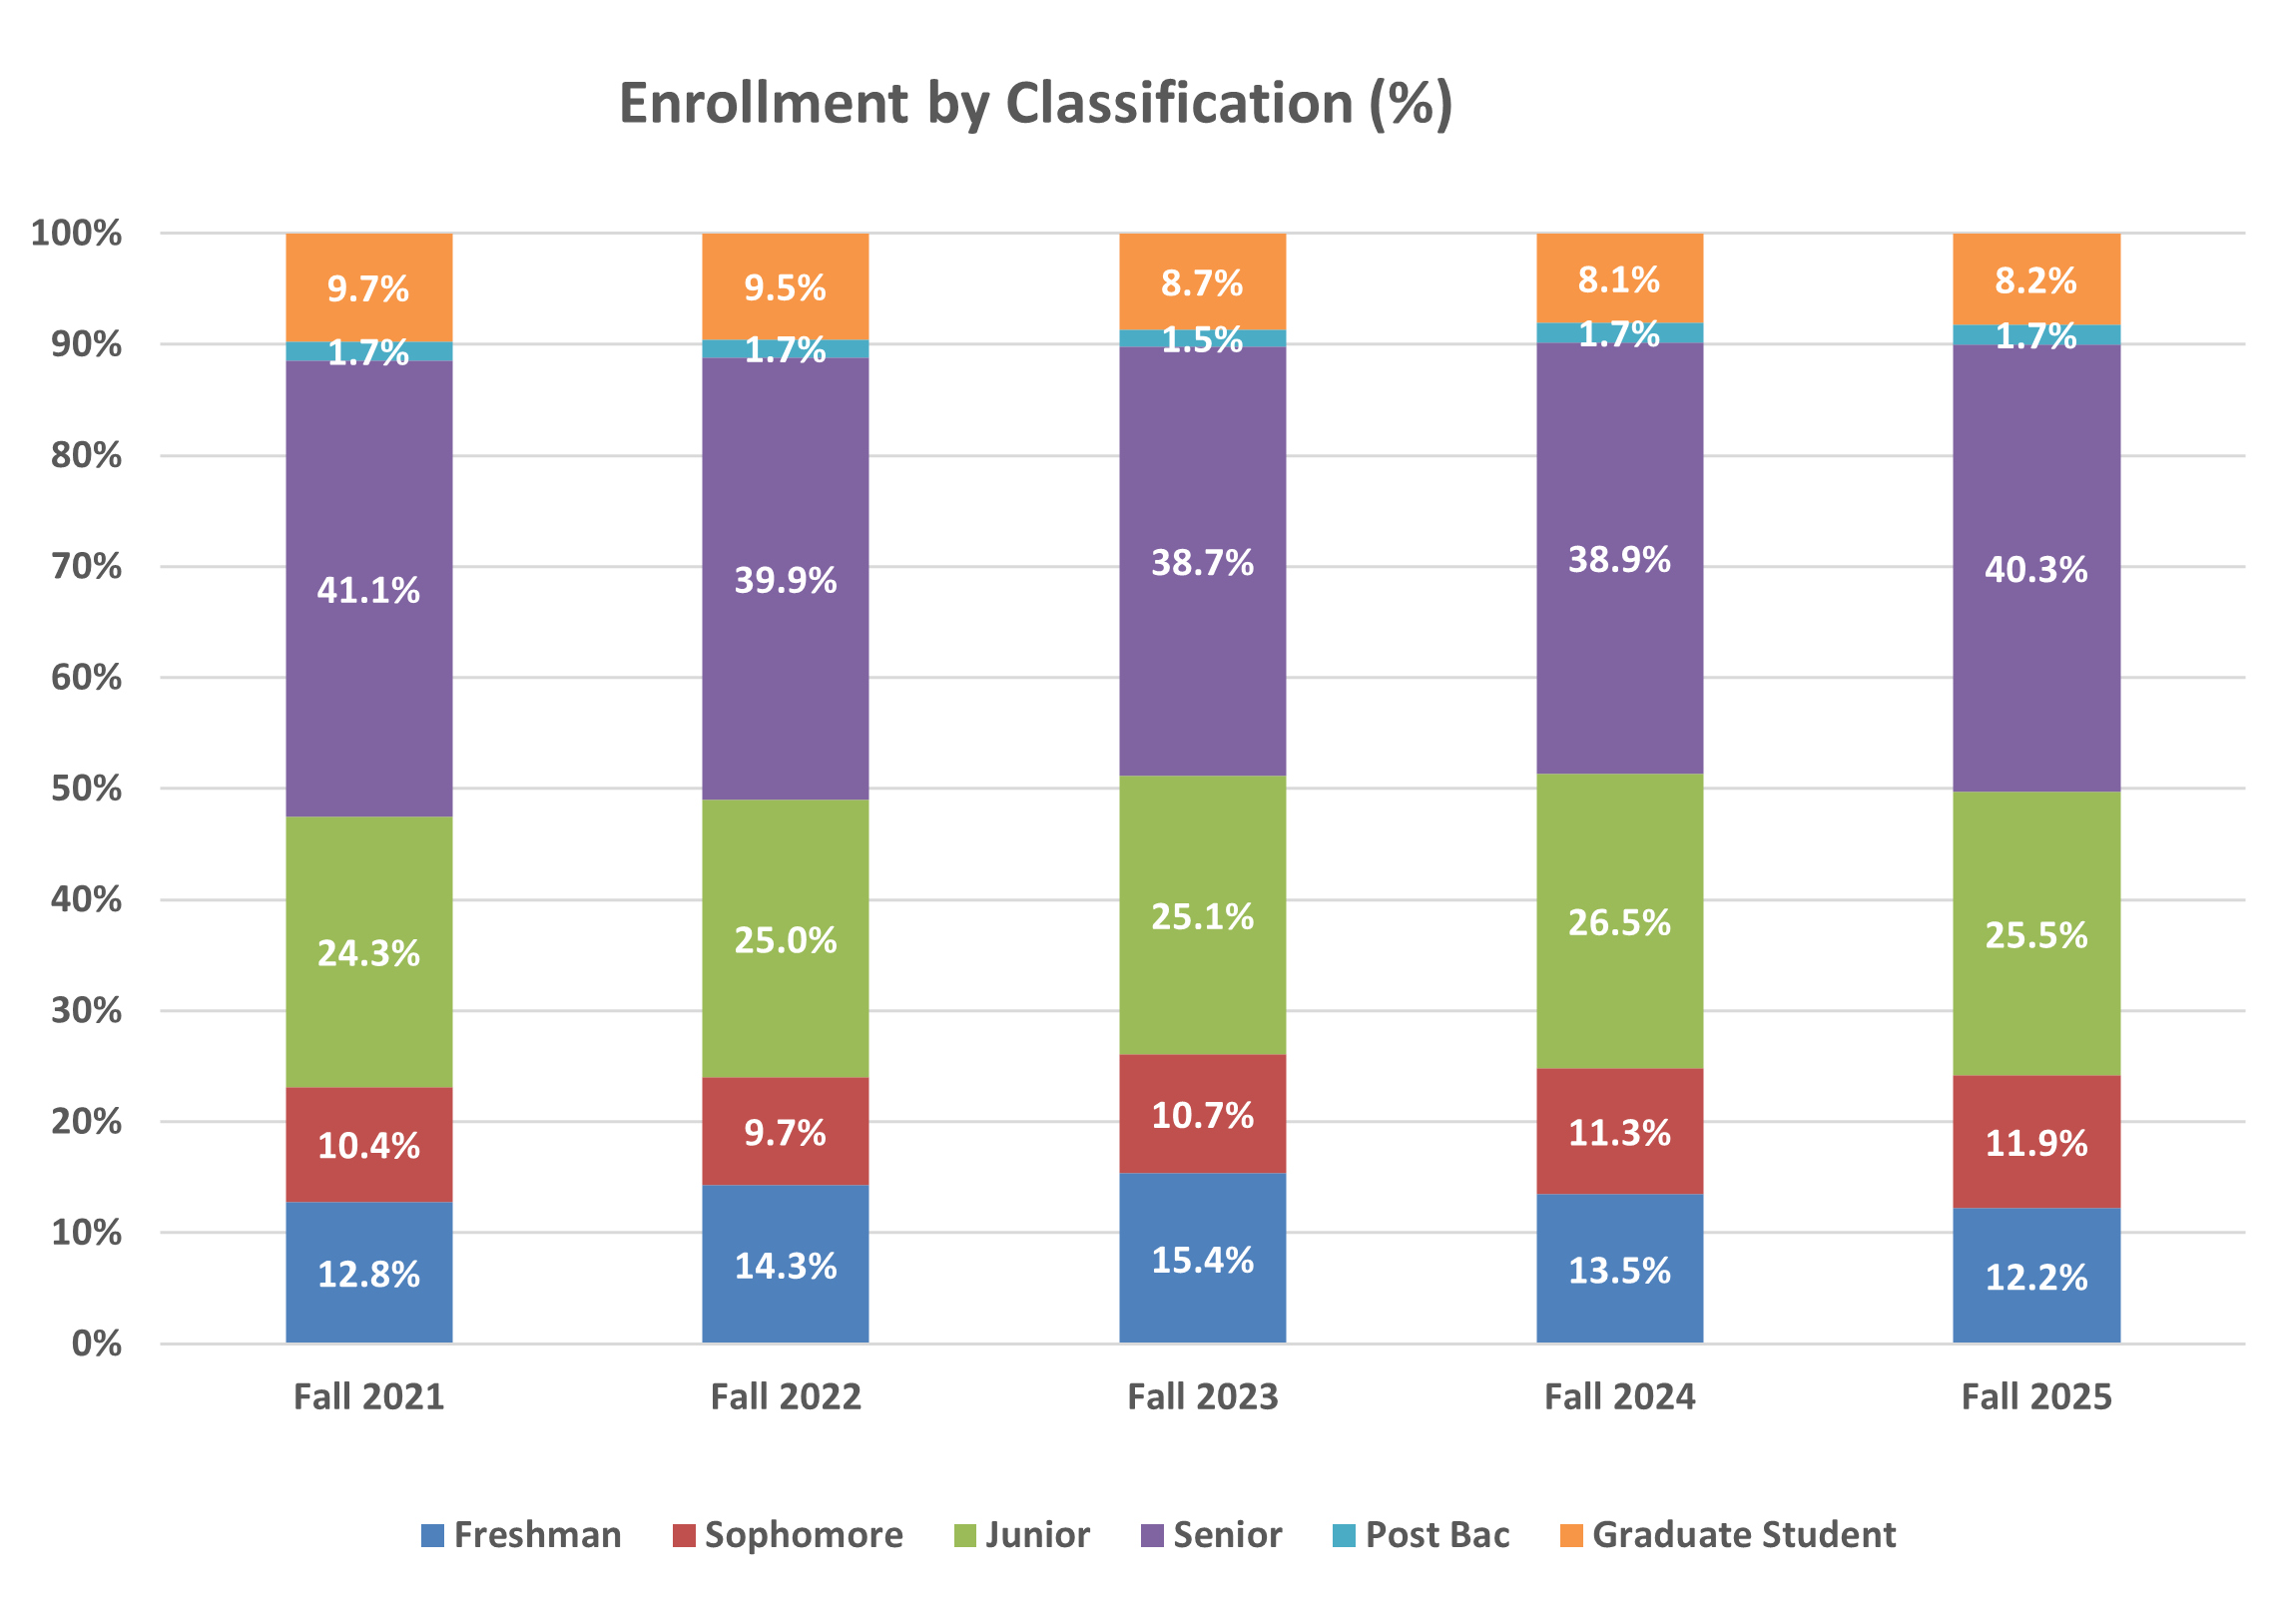
Source: CBM001