UHD / Office of the Provost / Office of Institutional Effectiveness / Office of Data Analytics & Institutional Research / Total Student Enrollment by Age Range
Total Student Enrollment by Age Range
*This page is best viewed in landscape mode
Average Age of Students
| Classification | Fall 2021 | Fall 2022 | Fall 2023 | Fall 2024 | Fall 2025 |
|---|---|---|---|---|---|
| Undergraduates | 26.7 | 26.3 | 26.1 | 26.0 | 25.7 |
| Graduate Students | 34.4 | 34.6 | 34.4 | 35.0 | 35.0 |
| All Students | 27.5 | 27.1 | 26.8 | 26.7 | 26.5 |
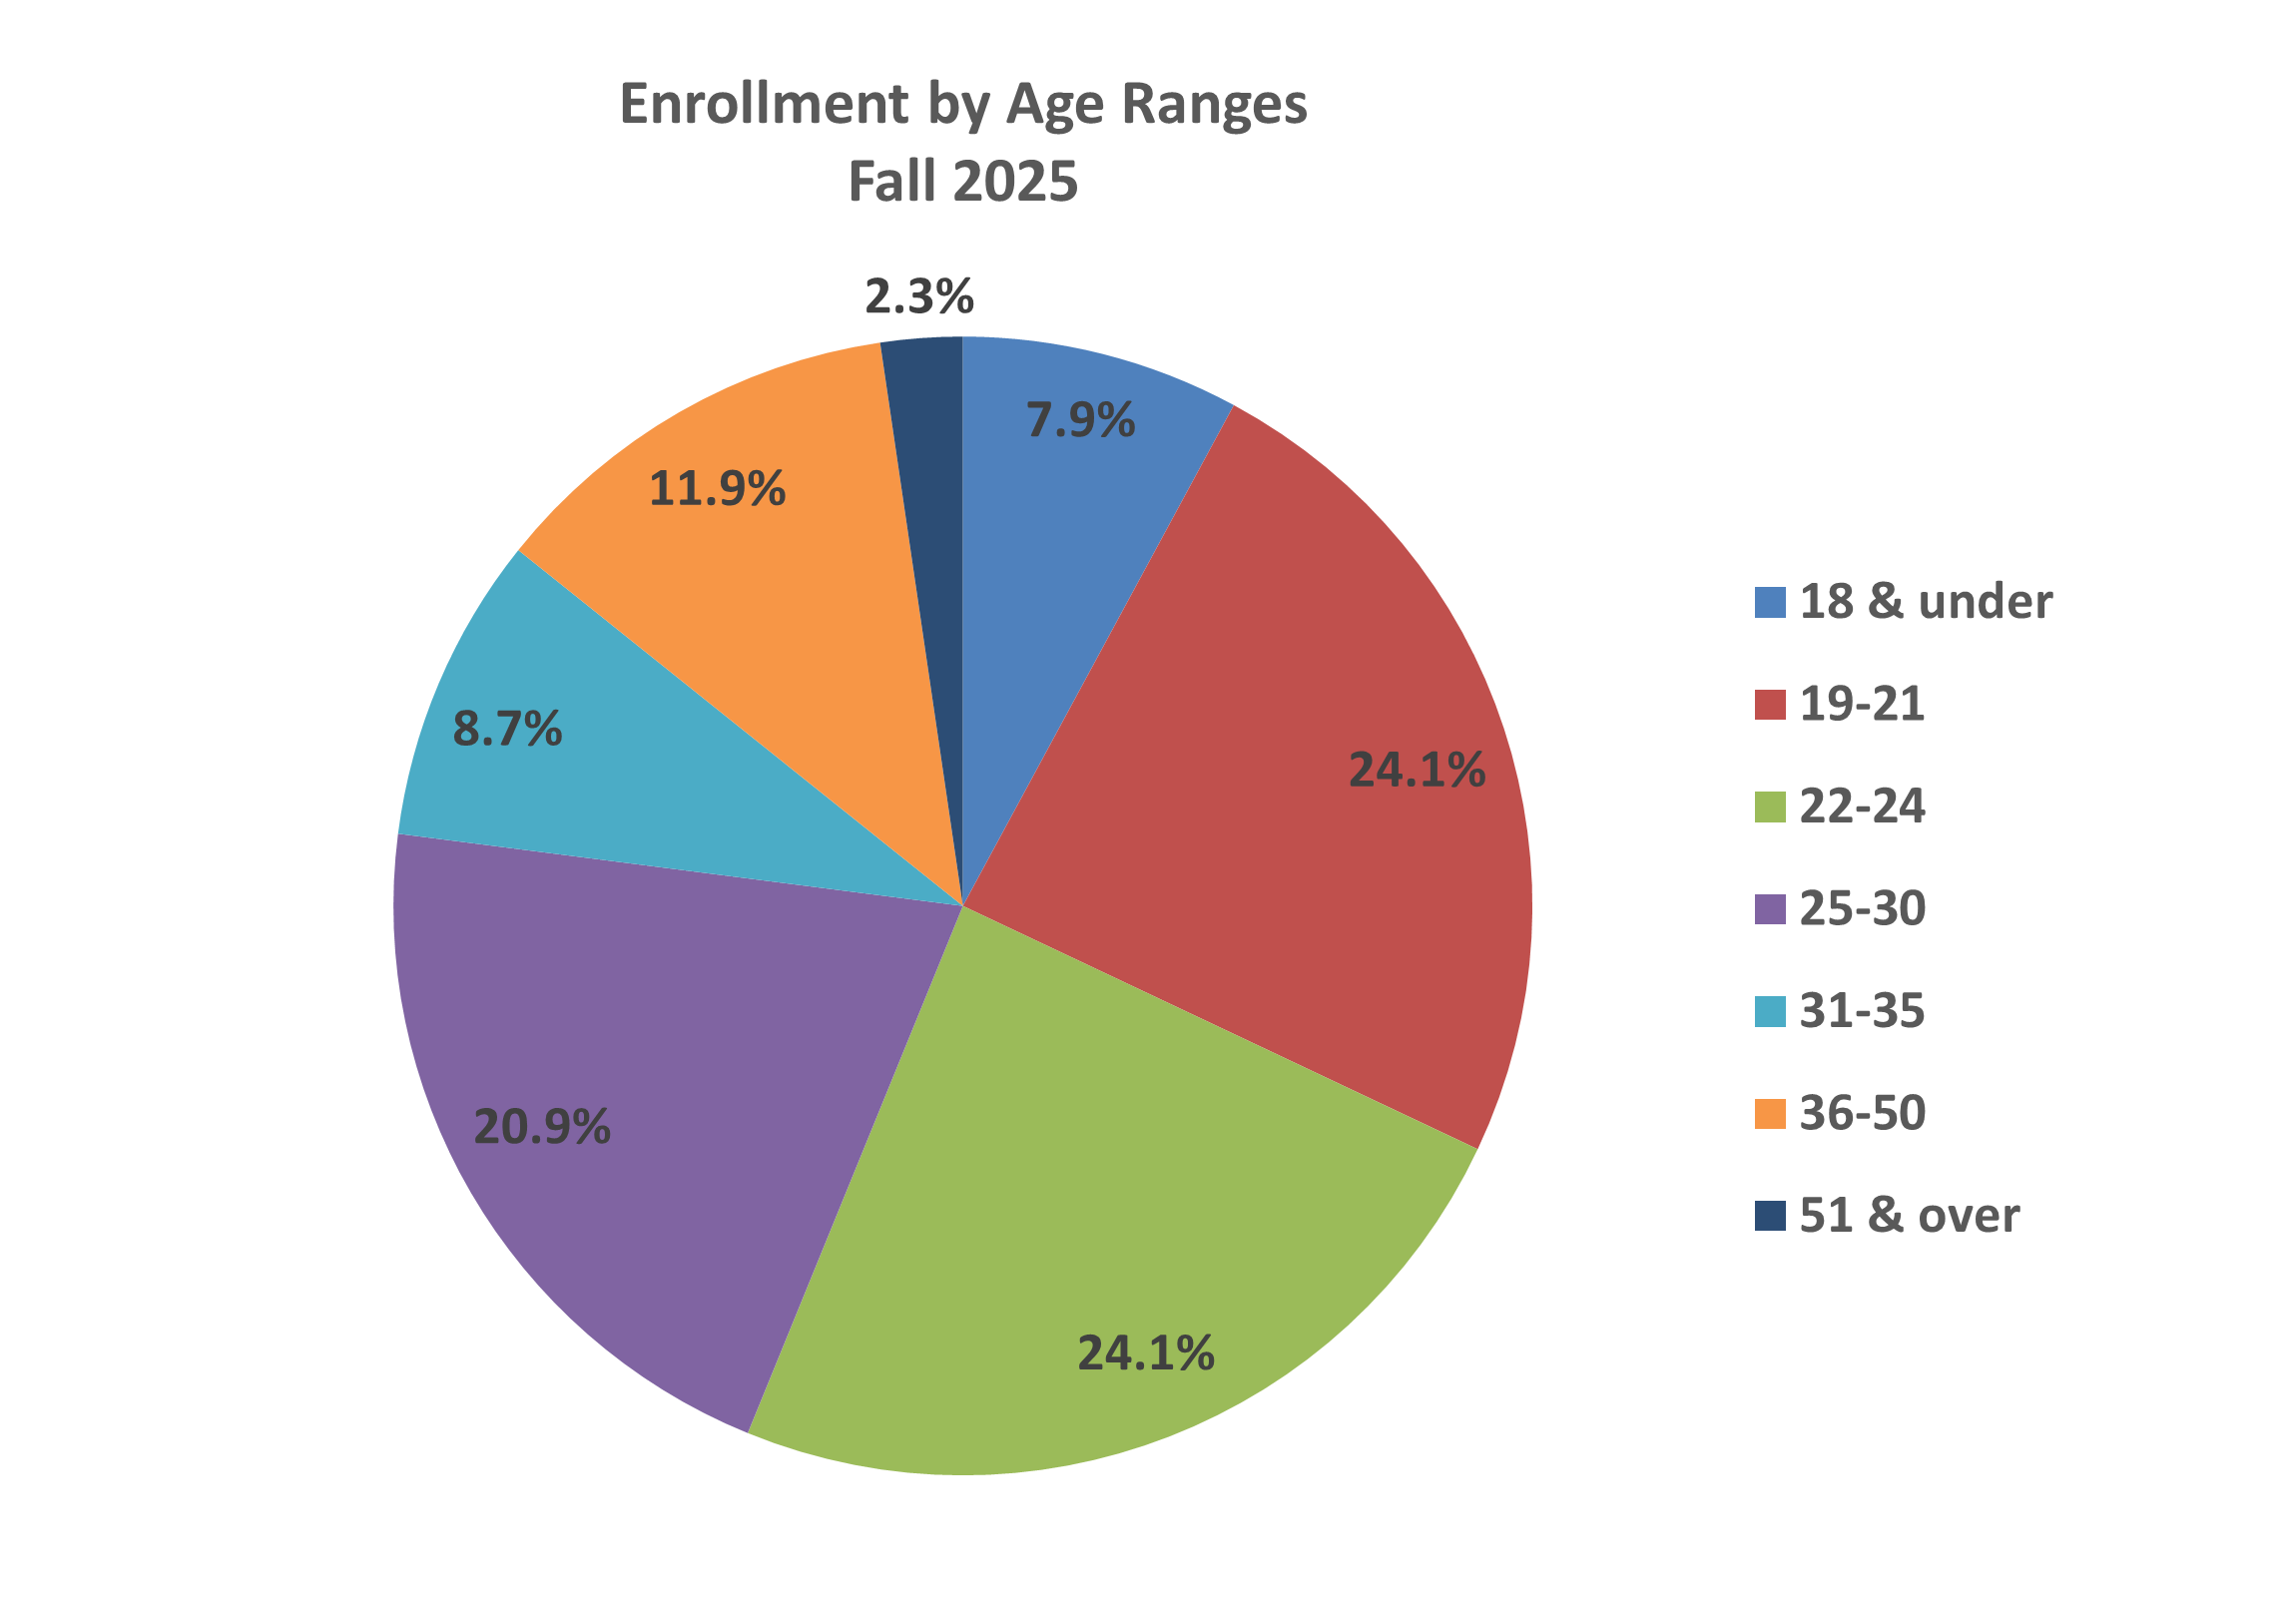
Enrollment by Age Range
| Age Range | Fall 2021 | Fall 2022 | Fall 2023 | Fall 2024 | Fall 2025 | % change from Previous Year |
|||||
|---|---|---|---|---|---|---|---|---|---|---|---|
| Under 17 | 0 | 0.0% | 2 | 0.0% | 0 | 0.0% | 1 | 0.0% | 1 | 0.0% | 0.0% |
| 17 | 51 | 0.3% | 46 | 0.3% | 27 | 0.2% | 36 | 0.3% | 37 | 0.3% | 2.8% |
| 18 | 1,151 | 7.6% | 1,169 | 8.2% | 1,077 | 7.6% | 897 | 6.5% | 1,032 | 7.6% | 15.1% |
| 19-21 | 3,165 | 21.0% | 3,223 | 22.7% | 3,287 | 23.3% | 3,404 | 24.8% | 3,272 | 24.1% | -3.9% |
| 22-24 | 3,055 | 20.3% | 2,975 | 20.9% | 3,228 | 22.9% | 3,202 | 23.3% | 3,273 | 24.1% | 2.2% |
| 25-30 | 3,513 | 23.3% | 3,141 | 22.1% | 3,035 | 21.5% | 2,894 | 21.1% | 2,828 | 20.9% | -2.3% |
| 31-35 | 1,636 | 10.9% | 1,414 | 10.0% | 1,379 | 9.8% | 1,333 | 9.7% | 1,182 | 8.7% | -11.3% |
| 36-50 | 2,091 | 13.9% | 1,803 | 12.7% | 1,714 | 12.2% | 1,616 | 11.8% | 1,618 | 11.9% | 0.1% |
| 51-64 | 389 | 2.6% | 408 | 2.9% | 331 | 2.3% | 315 | 2.3% | 289 | 2.1% | -8.3% |
| 65 and over | 26 | 0.2% | 27 | 0.2% | 27 | 0.2% | 32 | 0.2% | 26 | 0.2% | -18.8% |
| Total | 15,077 | 100.0% | 14,208 | 100.0% | 14,105 | 100.0% | 13,730 | 100.0% | 13,558 | 100.0% | -1.3% |
Sources: CBM001, CBM0C1