UHD / Office of the Provost / Office of Institutional Effectiveness / Office of Data Analytics & Institutional Research / Total Degree Graduates by Gender & Ethnicity
Total Degree Graduates by Gender & Ethnicity
*This page is best viewed in landscape mode
Female Male Overall Back to Fact Book Home
Female
| Ethnicity | 2020-2021 | 2021-2022 | 2022-2023 | 2023-2024 | 2024-2025 | % change from Previous Year |
|||||
|---|---|---|---|---|---|---|---|---|---|---|---|
| American Indian or Alaska Native | 3 | 0.1% | 2 | 0.1% | 2 | 0.1% | 1 | 0.0% | 2 | 0.1% | 50.0% |
| Asian | 192 | 8.4% | 168 | 7.2% | 145 | 6.9% | 151 | 6.8% | 148 | 6.7% | -2.0% |
| Black or African American | 526 | 23.1% | 503 | 21.5% | 445 | 21.3% | 498 | 22.5% | 488 | 22.1% | -2.0% |
| Hispanic/Latino | 1,054 | 46.3% | 1,210 | 51.7% | 1,103 | 52.7% | 1,189 | 53.8% | 1,191 | 54.0% | 0.2% |
| White | 364 | 16.0% | 320 | 13.7% | 266 | 12.7% | 246 | 11.1% | 249 | 11.3% | 1.2% |
| Native Hawaiian or Other Pacific Islander | 3 | 0.1% | 0 | 0.0% | 0 | 0.0% | 1 | 0.0% | 2 | 0.1% | 50.0% |
| Two or More Races | 50 | 2.2% | 62 | 2.6% | 57 | 2.7% | 59 | 2.7% | 56 | 2.5% | -5.4% |
| International | 63 | 2.8% | 56 | 2.4% | 66 | 3.2% | 54 | 2.4% | 52 | 2.4% | -3.8% |
| Race and ethnicity unknown | 21 | 0.9% | 19 | 0.8% | 10 | 0.5% | 10 | 0.5% | 18 | 0.8% | 44.4% |
| Total Females | 2,276 | 100.0% | 2,340 | 100.0% | 2,094 | 100.0% | 2,209 | 100.0% | 2,206 | 100.0% | -0.1% |
Male
| Ethnicity | 2020-2021 | 2021-2022 | 2022-2023 | 2023-2024 | 2024-2025 | % change from Previous Year |
|||||
|---|---|---|---|---|---|---|---|---|---|---|---|
| American Indian or Alaska Native | 1 | 0.1% | 5 | 0.4% | 1 | 0.1% | 2 | 0.2% | 1 | 0.1% | -100.0% |
| Asian | 156 | 12.8% | 141 | 12.0% | 150 | 13.0% | 148 | 12.4% | 154 | 13.0% | 3.9% |
| Black or African American | 199 | 16.3% | 215 | 18.2% | 206 | 17.8% | 197 | 16.5% | 188 | 15.8% | -4.8% |
| Hispanic/Latino | 517 | 42.4% | 514 | 43.6% | 525 | 45.5% | 542 | 45.5% | 565 | 47.5% | 4.1% |
| White | 252 | 20.7% | 225 | 19.1% | 193 | 16.7% | 218 | 18.3% | 193 | 16.2% | -13.0% |
| Native Hawaiian or Other Pacific Islander | 1 | 0.1% | 1 | 0.1% | 1 | 0.1% | 1 | 0.1% | 3 | 0.3% | 66.7% |
| Two or More Races | 31 | 2.5% | 28 | 2.4% | 31 | 2.7% | 33 | 2.8% | 33 | 2.8% | 0.0% |
| International | 50 | 4.1% | 37 | 3.1% | 43 | 3.7% | 44 | 3.7% | 45 | 3.8% | 2.2% |
| Race and ethnicity unknown | 13 | 1.1% | 13 | 1.1% | 5 | 0.4% | 6 | 0.5% | 7 | 0.6% | 14.3% |
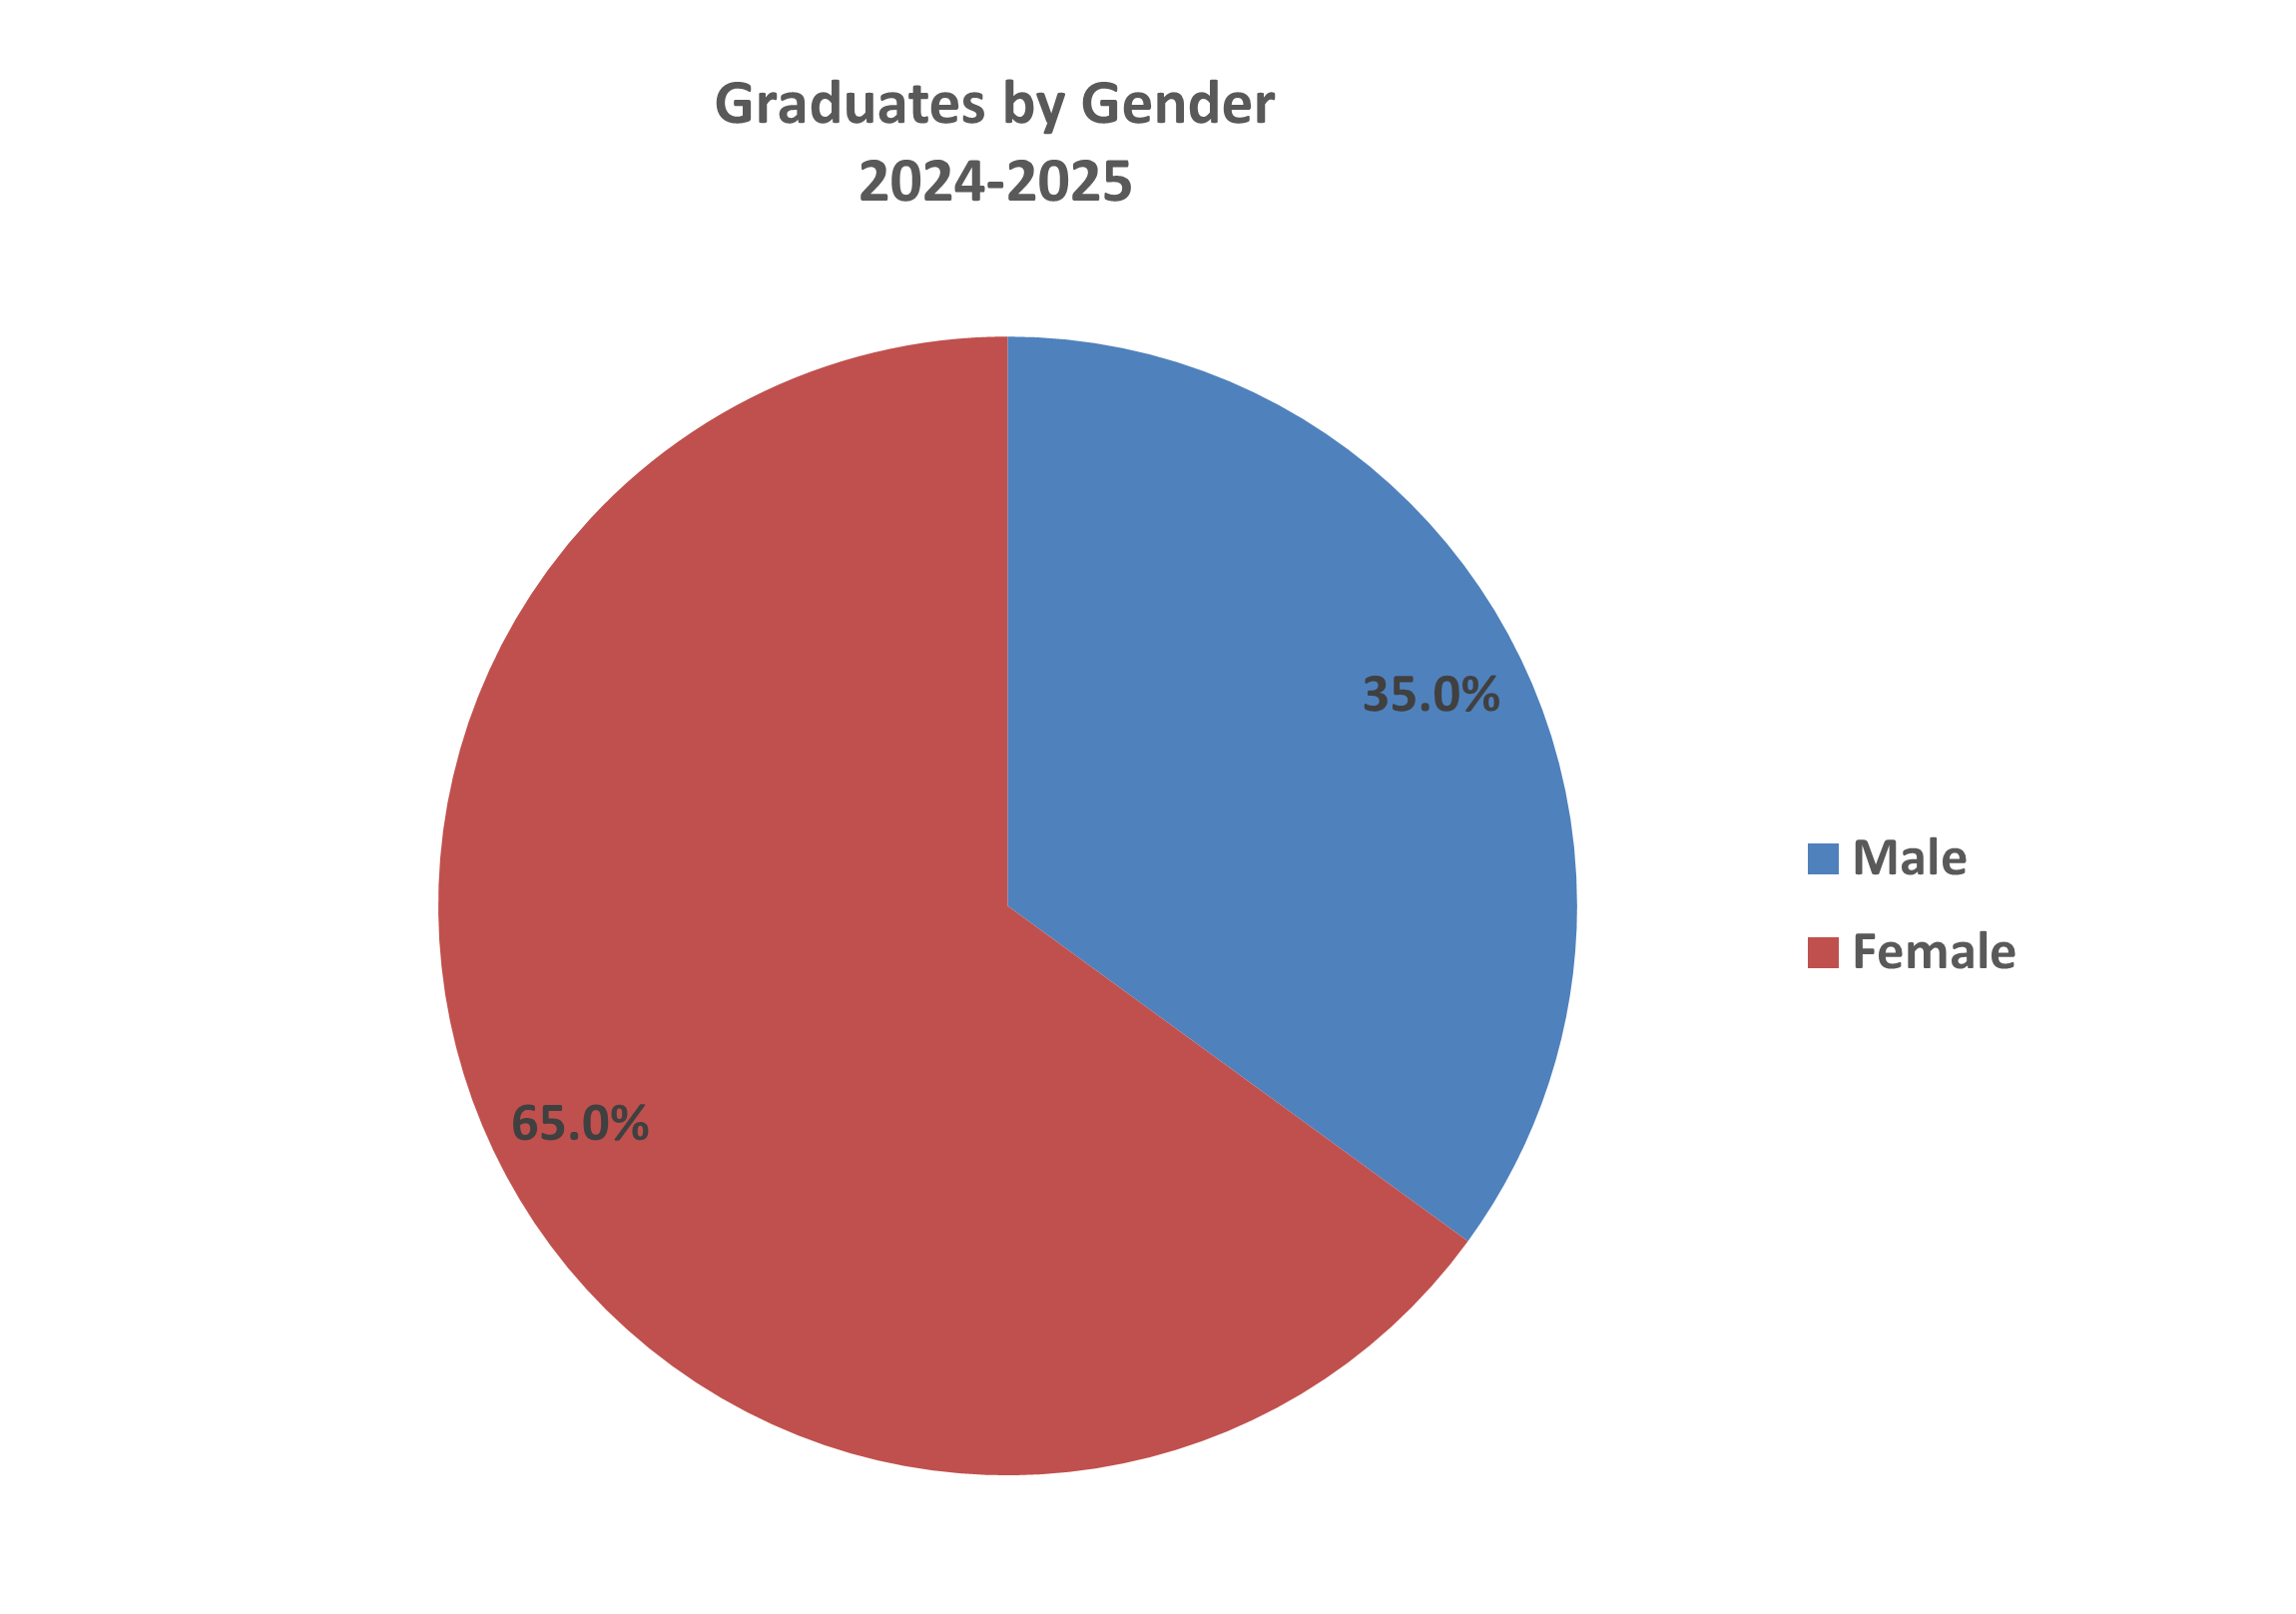
| Total Males | 1,220 | 100.0% | 1,179 | 100.0% | 1,155 | 100.0% | 1,191 | 100.0% | 1,189 | 100.0% | -0.2% |
Overall
| Ethnicity | 2020-2021 | 2021-2022 | 2022-2023 | 2023-2024 | 2024-2025 | % change from Previous Year |
|||||
|---|---|---|---|---|---|---|---|---|---|---|---|
| American Indian or Alaska Native | 4 | 0.1% | 7 | 0.2% | 3 | 0.1% | 3 | 0.1% | 3 | 0.1% | 0.0% |
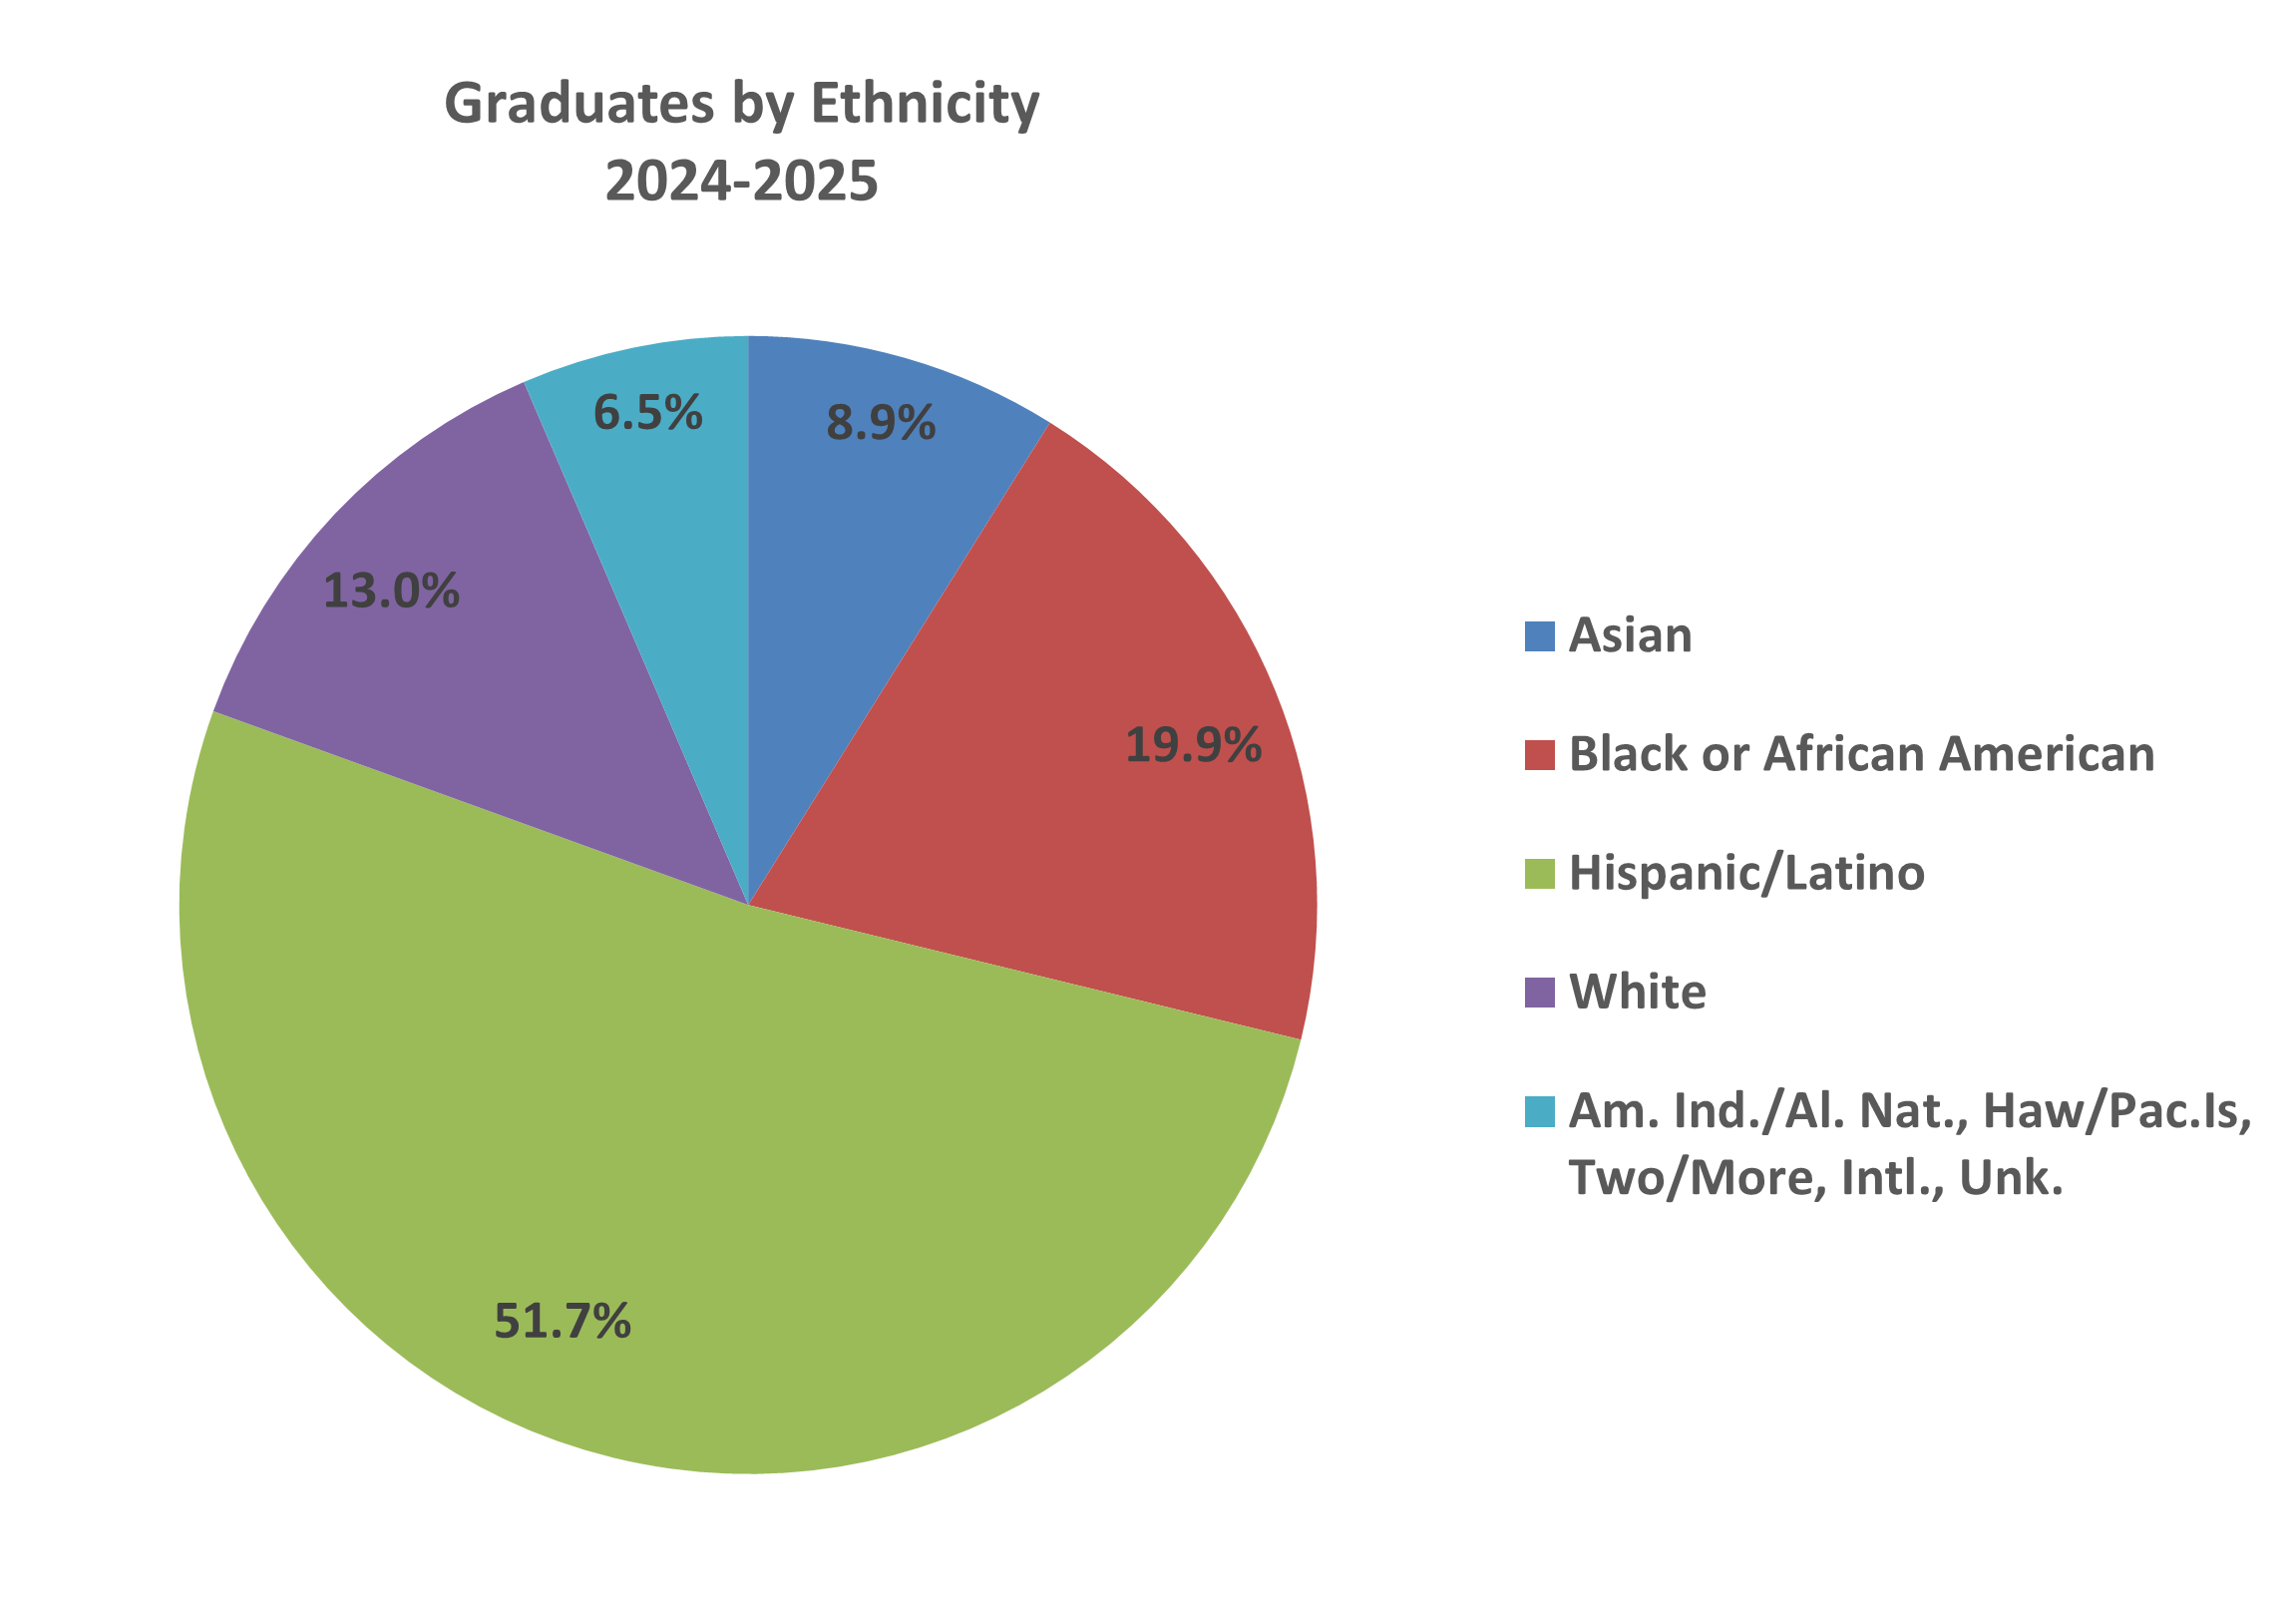
| Asian | 348 | 10.0% | 309 | 8.8% | 295 | 9.1% | 299 | 8.8% | 302 | 8.9% | 1.0% |
| Black or African American | 725 | 20.7% | 718 | 20.4% | 651 | 20.0% | 695 | 20.4% | 676 | 19.9% | -2.8% |
| Hispanic/Latino | 1,571 | 44.9% | 1,724 | 49.0% | 1,628 | 50.1% | 1,731 | 50.9% | 1,756 | 51.7% | 1.4% |
| White | 616 | 17.6% | 545 | 15.5% | 459 | 14.1% | 464 | 13.6% | 442 | 13.0% | -5.0% |
| Native Hawaiian or Other Pacific Islander | 4 | 0.1% | 1 | 0.0% | 1 | 0.0% | 2 | 0.1% | 5 | 0.1% | 60.0% |
| Two or More Races | 81 | 2.3% | 90 | 2.6% | 88 | 2.7% | 92 | 2.7% | 89 | 2.6% | -3.4% |
| International | 113 | 3.2% | 93 | 2.6% | 109 | 3.4% | 98 | 2.9% | 97 | 2.9% | -1.0% |
| Race and ethnicity unknown | 34 | 1.0% | 32 | 0.9% | 15 | 0.5% | 16 | 0.5% | 25 | 0.7% | 36.0% |
| Grand Total | 3,496 | 100.0% | 3,519 | 100.0% | 3,249 | 100.0% | 3,400 | 100.0% | 3,395 | 100.0% | -0.1% |
Source: CBM009
1Total may vary between degrees and graduates because a student may have multiple degrees but is counted only once by gender and ethnicity. This page only includes those earning bachelors and masters degrees, it does not include those earning graduate certificates.