UHD / Office of the Provost / Office of Institutional Effectiveness / Office of Data Analytics & Institutional Research / Graduate Certificate Graduates by Gender & Ethnicity
Graduate Certificate Graduates by Gender & Ethnicity
*This page is best viewed in landscape mode
Female Male Overall Back to Fact Book Home
Female
| Ethnicity | 2020 - 2021 | 2021 - 2022 | 2022 - 2023 | 2023 - 2024 | 2024 - 2025 | % change from Previous Year |
|||||
|---|---|---|---|---|---|---|---|---|---|---|---|
| American Indian or Alaska Native | 0 | 0.0% | 0 | 0.0% | 0 | 0.0% | 0 | 0.0% | 1 | 0.5% | - |
| Asian | 19 | 8.9% | 22 | 9.9% | 17 | 10.5% | 14 | 8.9% | 10 | 4.8% | -28.6% |
| Black or African American | 87 | 40.7% | 83 | 37.2% | 57 | 35.2% | 59 | 37.3% | 80 | 38.6% | 35.6% |
| Hispanic/Latino | 71 | 33.2% | 75 | 33.6% | 60 | 37.0% | 51 | 32.3% | 82 | 39.6% | 60.8% |
| White | 28 | 13.1% | 29 | 13.0% | 16 | 9.9% | 20 | 12.7% | 19 | 9.2% | -5.0% |
| Native Hawaiian or Other Pacific Islander | 0 | 0.0% | 0 | 0.0% | 0 | 0.0% | 1 | 0.6% | 1 | 0.5% | 0.0% |
| Two or More Races | 7 | 3.3% | 9 | 4.0% | 6 | 3.7% | 7 | 4.4% | 4 | 1.9% | -42.9% |
| International | 2 | 0.9% | 4 | 1.8% | 6 | 3.7% | 4 | 2.5% | 9 | 4.3% | 125.0% |
| Race and ethnicity unknown | 0 | 0.0% | 1 | 0.4% | 0 | 0.0% | 2 | 1.3% | 1 | 0.5% | -50.0% |
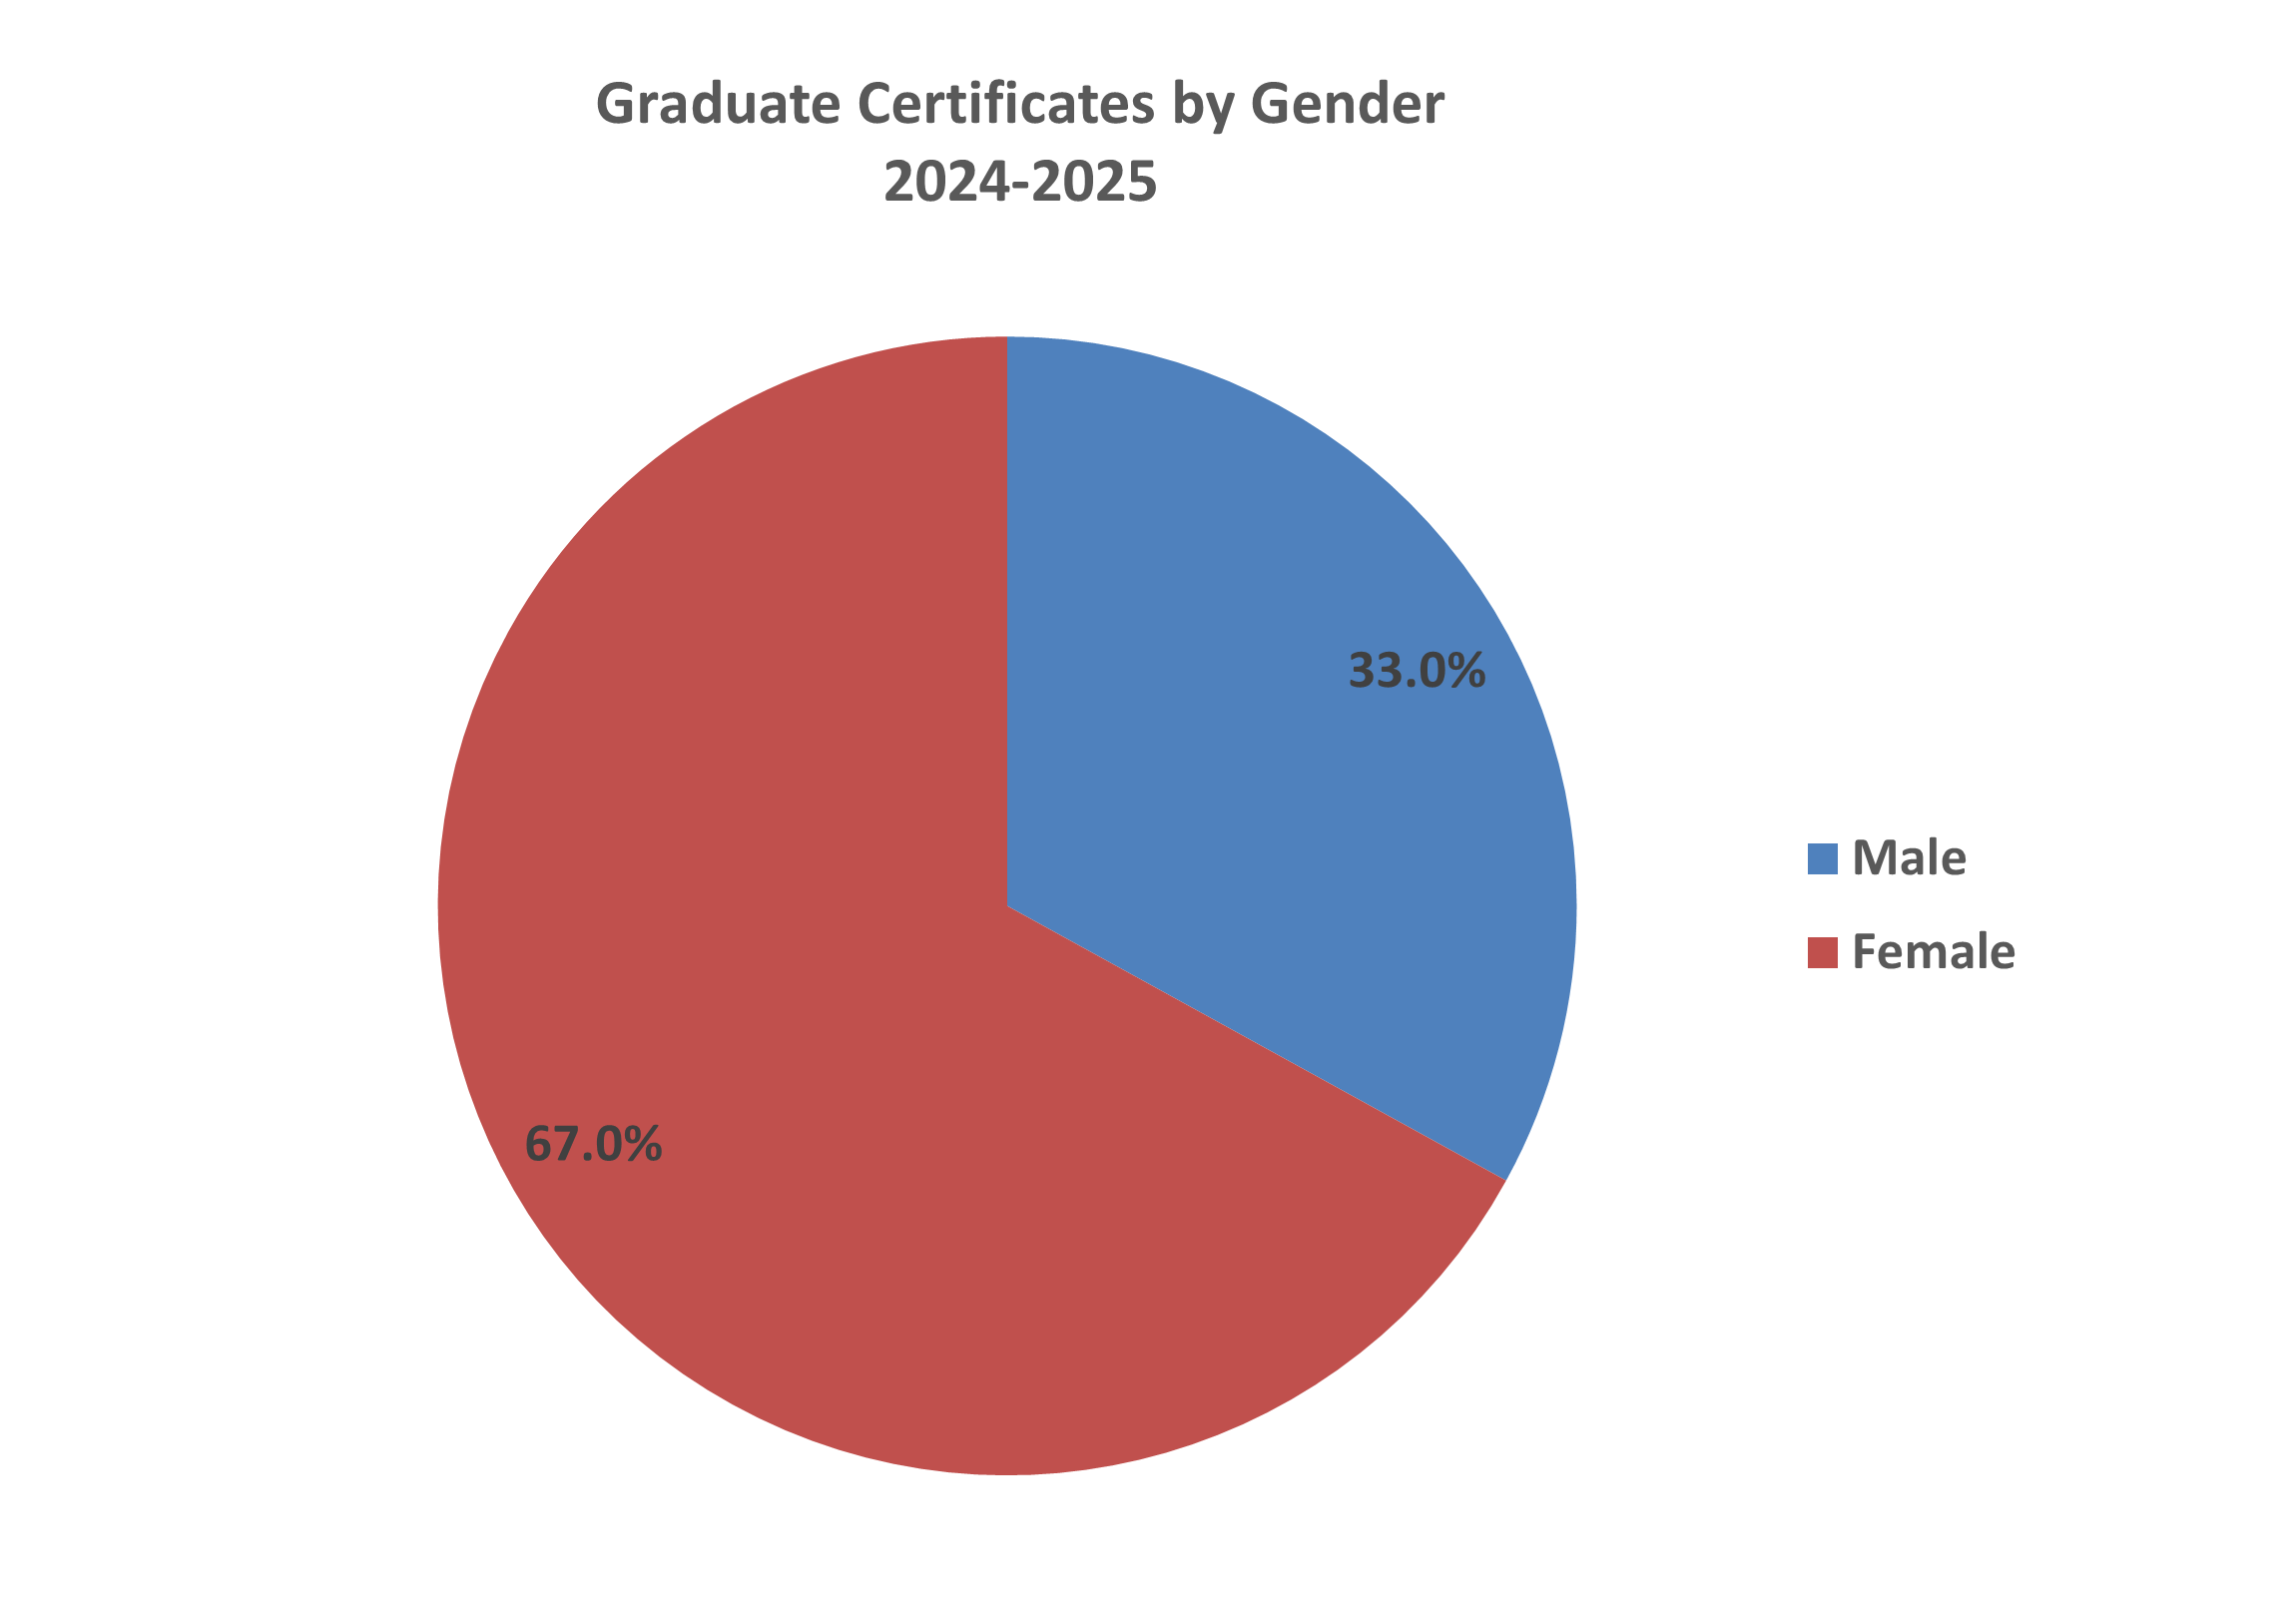
| Total Females | 214 | 100.0% | 223 | 100.0% | 162 | 100.0% | 158 | 100.0% | 207 | 100.0% | 31.0% |
Male
| Ethnicity | 2020 - 2021 | 2021 - 2022 | 2022 - 2023 | 2023 - 2024 | 2024 - 2025 | % change from Previous Year |
|||||
|---|---|---|---|---|---|---|---|---|---|---|---|
| American Indian or Alaska Native | 0 | 0.0% | 0 | 0.0% | 0 | 0.0% | 0 | 0.0% | 0 | 0.0% | - |
| Asian | 18 | 14.8% | 16 | 10.3% | 19 | 16.0% | 14 | 13.0% | 12 | 11.8% | -14.3% |
| Black or African American | 44 | 36.1% | 50 | 32.1% | 30 | 25.2% | 29 | 26.9% | 27 | 26.5% | -6.9% |
| Hispanic/Latino | 35 | 28.7% | 48 | 30.8% | 34 | 28.6% | 38 | 35.2% | 38 | 37.3% | 0.0% |
| White | 23 | 18.9% | 28 | 17.9% | 28 | 23.5% | 17 | 15.7% | 17 | 16.7% | 0.0% |
| Native Hawaiian or Other Pacific Islander | 0 | 0.0% | 0 | 0.0% | 0 | 0.0% | 0 | 0.0% | 0 | 0.0% | - |
| Two or More Races | 1 | 0.8% | 5 | 3.2% | 2 | 1.7% | 5 | 4.6% | 3 | 2.9% | -40.0% |
| International | 1 | 0.8% | 8 | 5.1% | 5 | 4.2% | 4 | 3.7% | 5 | 4.9% | 25.0% |
| Race and ethnicity unknown | 0 | 0.0% | 1 | 0.6% | 1 | 0.8% | 1 | 0.9% | 0 | 0.0% | -100.0% |
| Total Males | 122 | 100.0% | 156 | 100.0% | 119 | 100.0% | 108 | 100.0% | 102 | 100.0% | -5.6% |
Overall
| Ethnicity | 2020 - 2021 | 2021 - 2022 | 2022 - 2023 | 2023 - 2024 | 2024 - 2025 | % change from Previous Year |
|||||
|---|---|---|---|---|---|---|---|---|---|---|---|
| American Indian or Alaska Native | 0 | 0.0% | 0 | 0.0% | 0 | 0.0% | 0 | 0.0% | 1 | 0.3% | - |
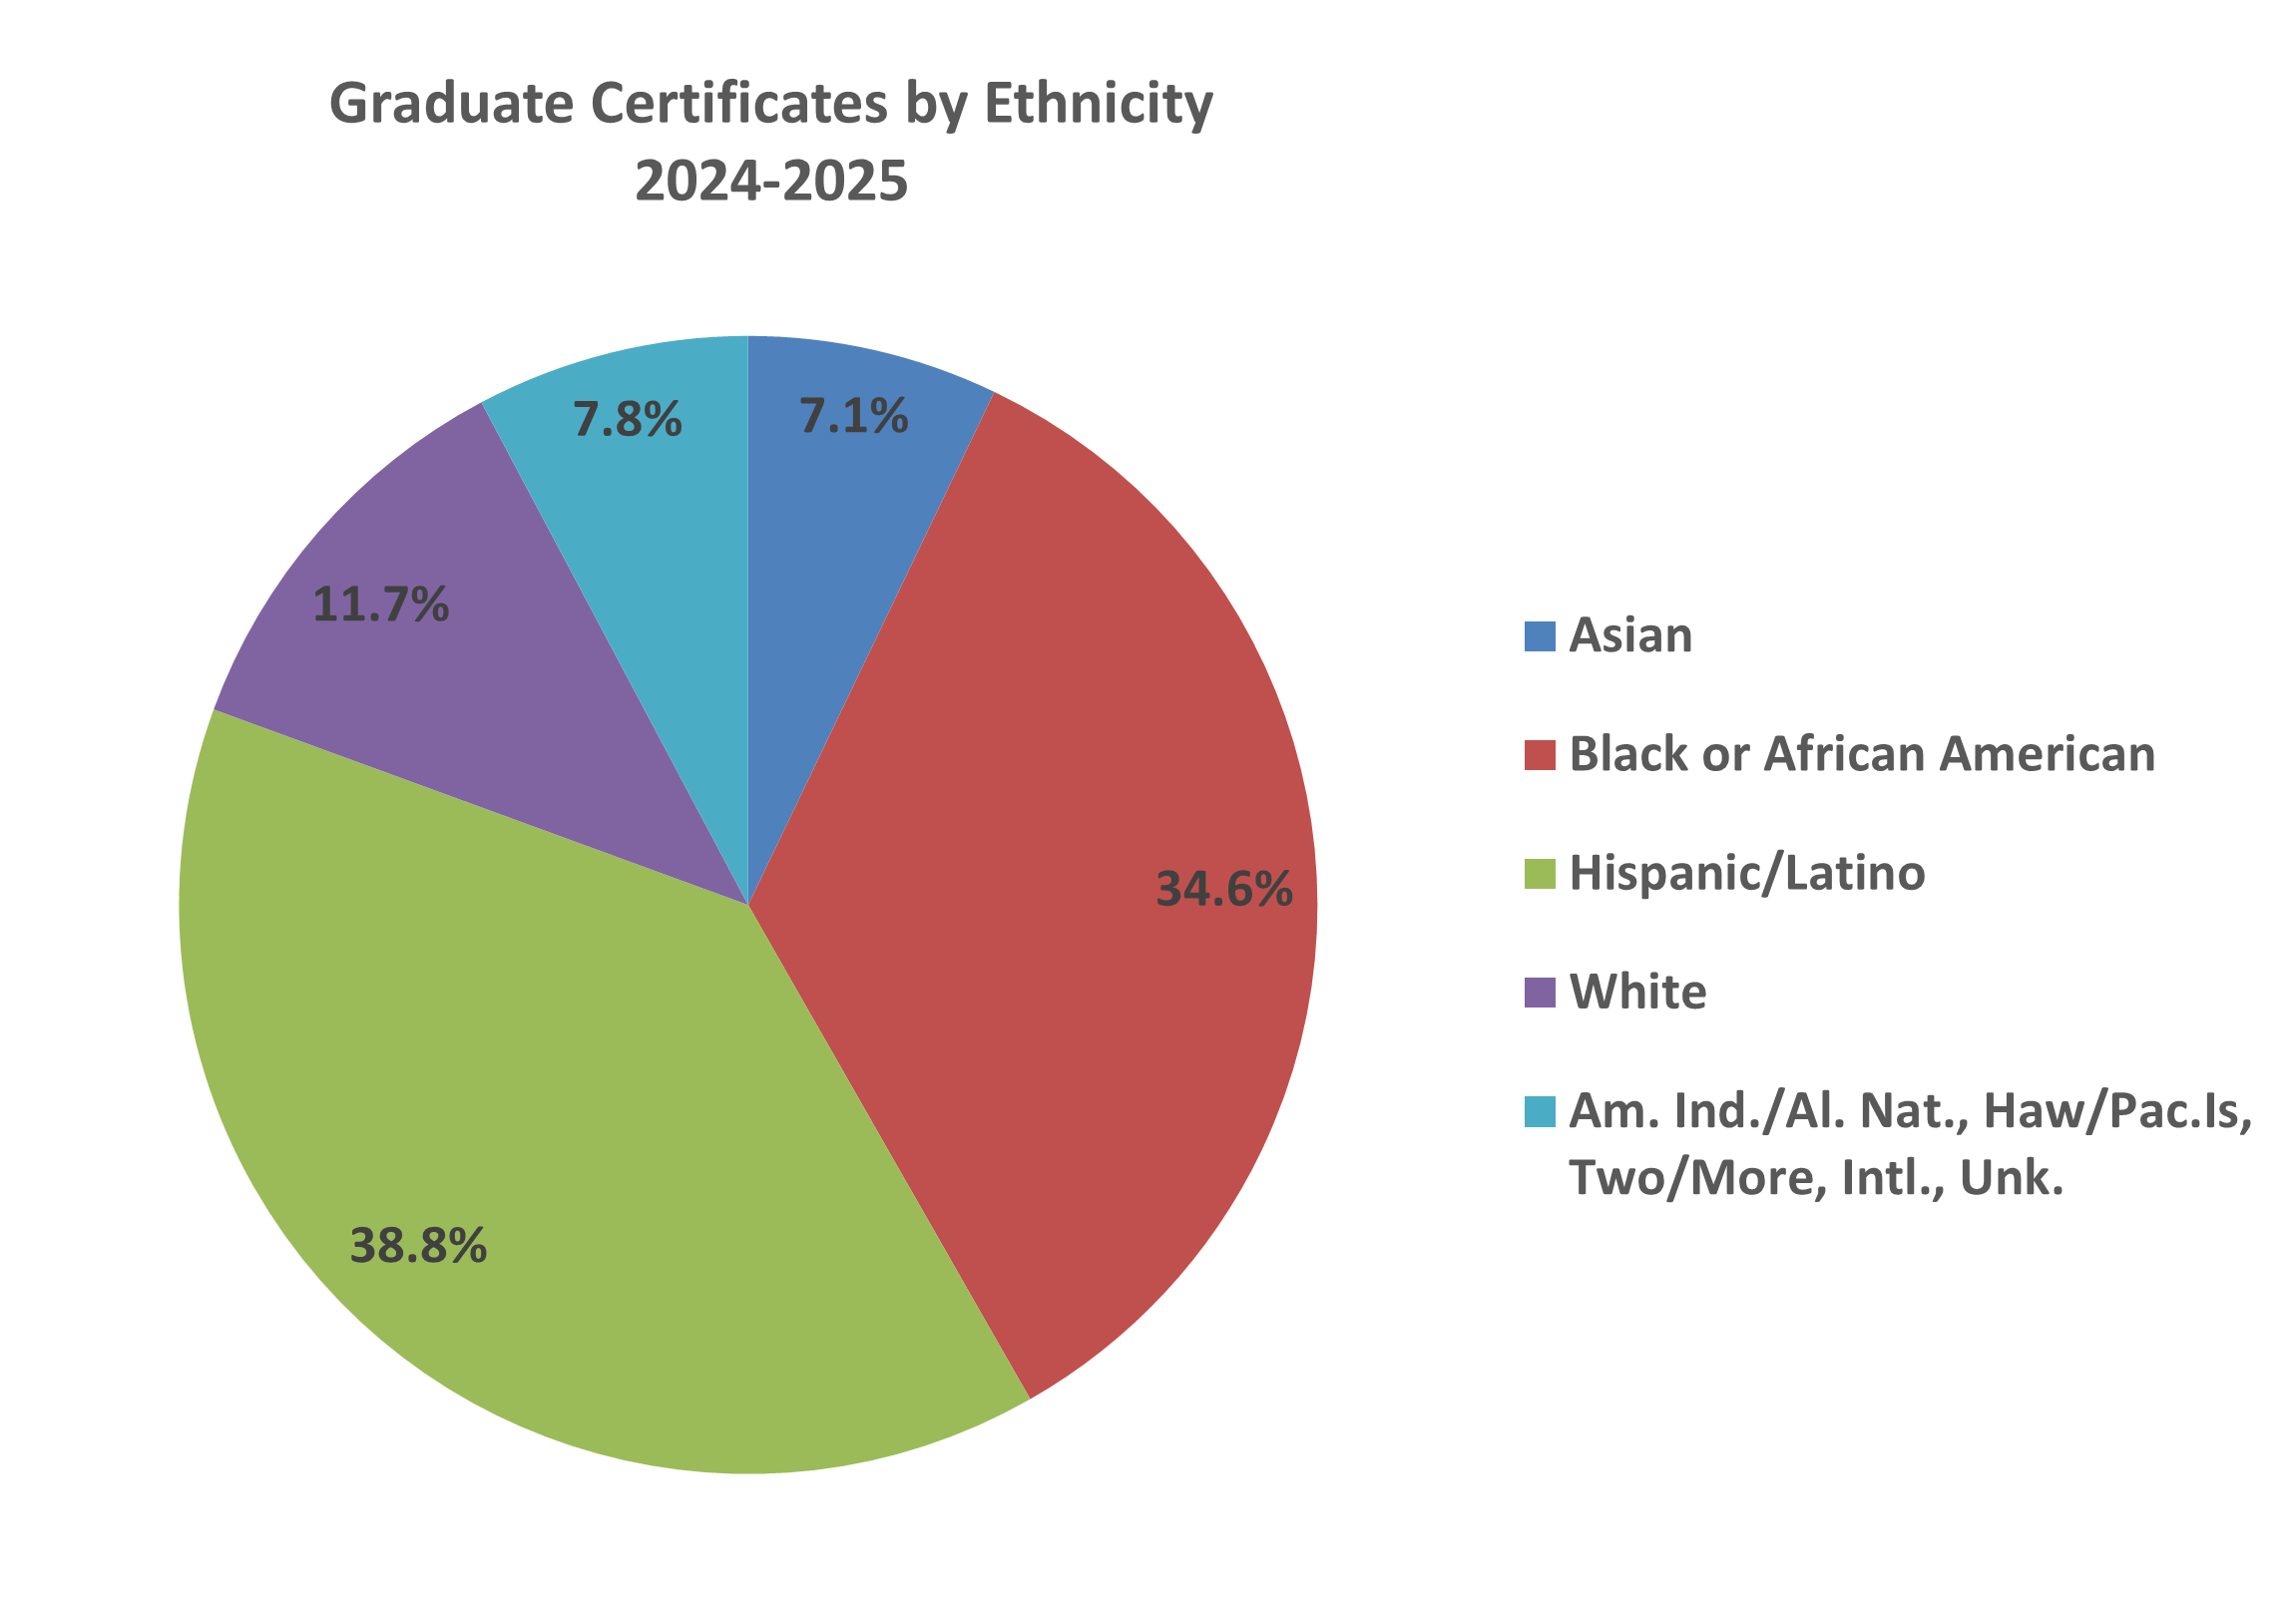
| Asian | 37 | 11.0% | 38 | 10.0% | 36 | 12.8% | 28 | 10.5% | 22 | 7.1% | -21.4% |
| Black or African American | 131 | 39.0% | 133 | 35.1% | 87 | 31.0% | 88 | 33.1% | 107 | 34.6% | 21.6% |
| Hispanic/Latino | 106 | 31.5% | 123 | 32.5% | 94 | 33.5% | 89 | 33.5% | 120 | 38.8% | 34.8% |
| White | 51 | 15.2% | 57 | 15.0% | 44 | 15.7% | 37 | 13.9% | 36 | 11.7% | -2.7% |
| Native Hawaiian or Other Pacific Islander | 0 | 0.0% | 0 | 0.0% | 0 | 0.0% | 1 | 0.4% | 1 | 0.3% | 0.0% |
| Two or More Races | 8 | 2.4% | 14 | 3.7% | 8 | 2.8% | 12 | 4.5% | 7 | 2.3% | -41.7% |
| International | 3 | 0.9% | 12 | 3.2% | 11 | 3.9% | 8 | 3.0% | 14 | 4.5% | 75.0% |
| Race and ethnicity unknown | 0 | 0.0% | 2 | 0.5% | 1 | 0.4% | 3 | 1.1% | 1 | 0.3% | -66.7% |
| Grand Total | 336 | 100.0% | 379 | 100.0% | 281 | 100.0% | 266 | 100.0% | 309 | 100.0% | 16.2% |
Source: CBM009, Internal report for certificates awarded
Total may differ from previous page because a student may have received multiple certificates
but is counted only once by gender and ethnicity.